
|
Shandong Yanggu Huatai Chemical Co., Ltd. (300121.sz) Valoración de DCF |
Completamente Editable: Adáptelo A Sus Necesidades En Excel O Sheets
Diseño Profesional: Plantillas Confiables Y Estándares De La Industria
Predeterminadas Para Un Uso Rápido Y Eficiente
Compatible con MAC / PC, completamente desbloqueado
No Se Necesita Experiencia; Fáciles De Seguir
Shandong Yanggu Huatai Chemical Co., Ltd. (300121.SZ) Bundle
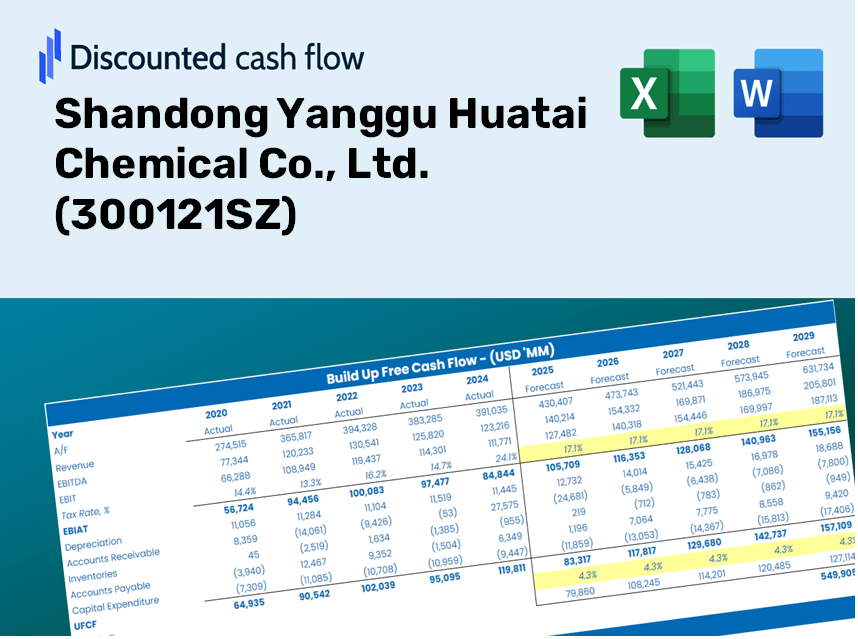
¡Simplifique la valoración de Shandong Yanggu Huatai Chemical Co., Ltd. (300121SZ) con esta calculadora DCF personalizable! Con el verdadero Shandong Yanggu Huatai Chemical Co., Ltd. (300121SZ) Financials y las entradas de pronóstico ajustables, puede probar escenarios y descubrir Shandong Yanggu Huatai Chemical Co., Ltd. (300121SZ) Valor razonable en minutos.
Discounted Cash Flow (DCF) - (USD MM)
| Year | AY1 2020 |
AY2 2021 |
AY3 2022 |
AY4 2023 |
AY5 2024 |
FY1 2025 |
FY2 2026 |
FY3 2027 |
FY4 2028 |
FY5 2029 |
|---|---|---|---|---|---|---|---|---|---|---|
| Revenue | 1,943.4 | 2,705.3 | 3,517.2 | 3,454.6 | 3,430.8 | 4,003.3 | 4,671.4 | 5,450.9 | 6,360.5 | 7,421.8 |
| Revenue Growth, % | 0 | 39.21 | 30.01 | -1.78 | -0.68886 | 16.69 | 16.69 | 16.69 | 16.69 | 16.69 |
| EBITDA | 252.5 | 482.7 | 774.3 | 562.3 | 465.1 | 662.0 | 772.5 | 901.4 | 1,051.8 | 1,227.3 |
| EBITDA, % | 12.99 | 17.84 | 22.02 | 16.28 | 13.56 | 16.54 | 16.54 | 16.54 | 16.54 | 16.54 |
| Depreciation | 88.7 | 117.8 | 132.4 | 153.0 | 186.3 | 180.5 | 210.6 | 245.7 | 286.7 | 334.6 |
| Depreciation, % | 4.57 | 4.35 | 3.76 | 4.43 | 5.43 | 4.51 | 4.51 | 4.51 | 4.51 | 4.51 |
| EBIT | 163.8 | 364.9 | 641.9 | 409.3 | 278.8 | 481.5 | 561.9 | 655.7 | 765.1 | 892.7 |
| EBIT, % | 8.43 | 13.49 | 18.25 | 11.85 | 8.13 | 12.03 | 12.03 | 12.03 | 12.03 | 12.03 |
| Total Cash | 174.0 | 201.7 | 460.1 | 878.0 | 754.5 | 615.7 | 718.4 | 838.3 | 978.2 | 1,141.5 |
| Total Cash, percent | .0 | .0 | .0 | .0 | .0 | .0 | .0 | .0 | .0 | .0 |
| Account Receivables | 770.6 | 843.2 | 1,186.0 | 1,234.6 | 1,226.9 | 1,409.5 | 1,644.7 | 1,919.1 | 2,239.4 | 2,613.1 |
| Account Receivables, % | 39.65 | 31.17 | 33.72 | 35.74 | 35.76 | 35.21 | 35.21 | 35.21 | 35.21 | 35.21 |
| Inventories | 195.7 | 305.6 | 414.6 | 402.5 | 492.6 | 473.7 | 552.7 | 645.0 | 752.6 | 878.2 |
| Inventories, % | 10.07 | 11.29 | 11.79 | 11.65 | 14.36 | 11.83 | 11.83 | 11.83 | 11.83 | 11.83 |
| Accounts Payable | 366.5 | 380.5 | 461.1 | 240.6 | 322.8 | 499.7 | 583.0 | 680.3 | 793.8 | 926.3 |
| Accounts Payable, % | 18.86 | 14.06 | 13.11 | 6.96 | 9.41 | 12.48 | 12.48 | 12.48 | 12.48 | 12.48 |
| Capital Expenditure | -229.2 | -138.1 | -171.8 | -317.2 | -369.5 | -334.2 | -389.9 | -455.0 | -530.9 | -619.5 |
| Capital Expenditure, % | -11.79 | -5.11 | -4.88 | -9.18 | -10.77 | -8.35 | -8.35 | -8.35 | -8.35 | -8.35 |
| Tax Rate, % | 19.09 | 19.09 | 19.09 | 19.09 | 19.09 | 19.09 | 19.09 | 19.09 | 19.09 | 19.09 |
| EBITAT | 132.0 | 297.5 | 527.6 | 326.6 | 225.6 | 390.1 | 455.1 | 531.1 | 619.7 | 723.1 |
| Depreciation | ||||||||||
| Changes in Account Receivables | ||||||||||
| Changes in Inventories | ||||||||||
| Changes in Accounts Payable | ||||||||||
| Capital Expenditure | ||||||||||
| UFCF | -608.2 | 108.6 | 117.0 | -94.6 | 42.0 | 249.6 | 44.9 | 52.4 | 61.2 | 71.4 |
| WACC, % | 6.14 | 6.15 | 6.15 | 6.14 | 6.14 | 6.15 | 6.15 | 6.15 | 6.15 | 6.15 |
| PV UFCF | ||||||||||
| SUM PV UFCF | 420.0 | |||||||||
| Long Term Growth Rate, % | 2.00 | |||||||||
| Free cash flow (T + 1) | 73 | |||||||||
| Terminal Value | 1,756 | |||||||||
| Present Terminal Value | 1,304 | |||||||||
| Enterprise Value | 1,724 | |||||||||
| Net Debt | -78 | |||||||||
| Equity Value | 1,802 | |||||||||
| Diluted Shares Outstanding, MM | 409 | |||||||||
| Equity Value Per Share | 4.41 |
What You'll Receive
- Pre-Filled Financial Model: Utilize Shandong Yanggu Huatai Chemical's actual data for accurate DCF valuation.
- Complete Forecasting Control: Modify revenue projections, profit margins, WACC, and other vital factors.
- Real-Time Calculations: Automatic updates allow you to see results instantly as you make adjustments.
- Investor-Ready Template: A polished Excel file crafted for high-quality valuation presentations.
- Customizable and Reusable: Designed for versatility, making it suitable for multiple in-depth forecasts.
Key Features
- Authentic Financial Data for Shandong Yanggu Huatai Chemical: Gain access to precise pre-loaded historical data and future projections specific to (300121SZ).
- Tailorable Forecast Assumptions: Modify the highlighted cells to adjust WACC, growth rates, and profit margins.
- Real-Time Calculations: Automatic recalculations for DCF, Net Present Value (NPV), and cash flow metrics.
- User-Friendly Dashboard: Intuitive charts and summaries that help you visualize your valuation outcomes.
- Designed for All Skill Levels: A straightforward, navigable structure ideal for investors, CFOs, and consultants alike.
How It Works
- Step 1: Download the prebuilt Excel template featuring Shandong Yanggu Huatai Chemical Co., Ltd.'s (300121SZ) data.
- Step 2: Review the pre-filled sheets to familiarize yourself with the critical metrics.
- Step 3: Modify forecasts and key assumptions in the editable yellow cells (WACC, growth rates, profit margins).
- Step 4: Instantly access recalculated results, including the intrinsic value of Shandong Yanggu Huatai Chemical Co., Ltd. (300121SZ).
- Step 5: Utilize the outputs to make well-informed investment decisions or create detailed reports.
Why Opt for Our Calculator?
- Time-Efficient: Skip the hassle of building a DCF model from the ground up – it's pre-configured for immediate use.
- Enhanced Accuracy: Dependable financial data and equations help minimize valuation errors.
- Fully Customizable: Adapt the model to suit your unique assumptions and forecasts.
- User-Friendly: Intuitive charts and outputs simplify result analysis.
- Preferred by Professionals: Crafted for experts who prioritize both precision and ease of use.
Who Can Benefit from This Product?
- Professional Investors: Create comprehensive and accurate valuation models for analyzing portfolios related to Shandong Yanggu Huatai Chemical Co., Ltd. (300121SZ).
- Corporate Finance Teams: Evaluate various valuation scenarios to inform internal strategies for Shandong Yanggu Huatai Chemical Co., Ltd. (300121SZ).
- Consultants and Advisors: Deliver precise valuation insights for clients interested in Shandong Yanggu Huatai Chemical Co., Ltd. (300121SZ).
- Students and Educators: Utilize real market data to learn and teach financial modeling techniques relevant to Shandong Yanggu Huatai Chemical Co., Ltd. (300121SZ).
- Industry Enthusiasts: Gain insights into how chemical companies like Shandong Yanggu Huatai Chemical Co., Ltd. (300121SZ) are valued in the financial market.
Contents of the Template
- Historical Data: Comprises past financial information and baseline forecasts for Shandong Yanggu Huatai Chemical Co., Ltd. (300121SZ).
- DCF and Levered DCF Models: Comprehensive templates to evaluate the intrinsic value of Shandong Yanggu Huatai Chemical Co., Ltd. (300121SZ).
- WACC Sheet: Ready-to-use calculations for the Weighted Average Cost of Capital.
- Editable Inputs: Adjust key parameters such as growth rates, EBITDA percentages, and CAPEX estimates.
- Quarterly and Annual Statements: A thorough analysis of the financial performance of Shandong Yanggu Huatai Chemical Co., Ltd. (300121SZ).
- Interactive Dashboard: Dynamically visualize valuation outcomes and future projections.
Disclaimer
All information, articles, and product details provided on this website are for general informational and educational purposes only. We do not claim any ownership over, nor do we intend to infringe upon, any trademarks, copyrights, logos, brand names, or other intellectual property mentioned or depicted on this site. Such intellectual property remains the property of its respective owners, and any references here are made solely for identification or informational purposes, without implying any affiliation, endorsement, or partnership.
We make no representations or warranties, express or implied, regarding the accuracy, completeness, or suitability of any content or products presented. Nothing on this website should be construed as legal, tax, investment, financial, medical, or other professional advice. In addition, no part of this site—including articles or product references—constitutes a solicitation, recommendation, endorsement, advertisement, or offer to buy or sell any securities, franchises, or other financial instruments, particularly in jurisdictions where such activity would be unlawful.
All content is of a general nature and may not address the specific circumstances of any individual or entity. It is not a substitute for professional advice or services. Any actions you take based on the information provided here are strictly at your own risk. You accept full responsibility for any decisions or outcomes arising from your use of this website and agree to release us from any liability in connection with your use of, or reliance upon, the content or products found herein.