
|
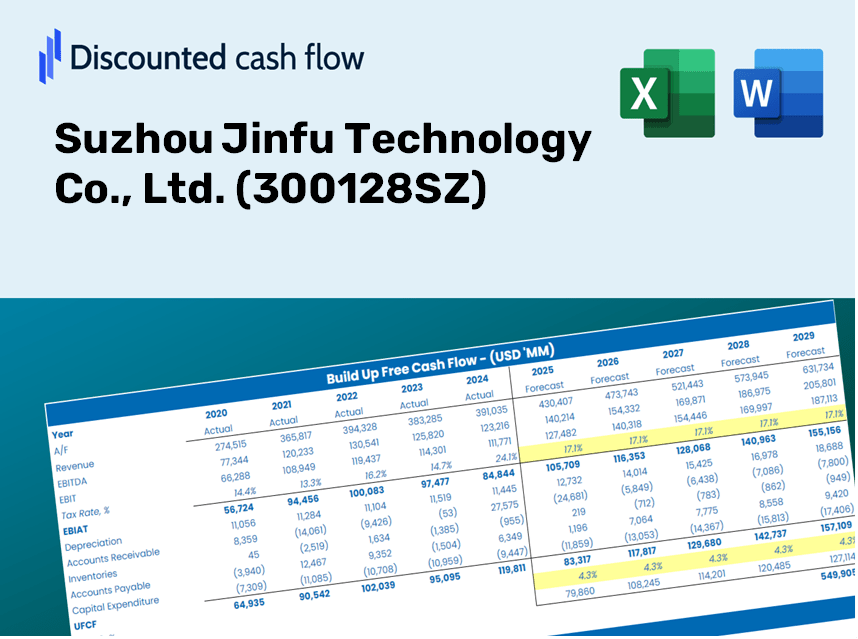
Suzhou Jinfu Technology Co., Ltd. (300128.SZ) Valoración de DCF |
Completamente Editable: Adáptelo A Sus Necesidades En Excel O Sheets
Diseño Profesional: Plantillas Confiables Y Estándares De La Industria
Predeterminadas Para Un Uso Rápido Y Eficiente
Compatible con MAC / PC, completamente desbloqueado
No Se Necesita Experiencia; Fáciles De Seguir
Suzhou Jinfu Technology Co., Ltd. (300128.SZ) Bundle
Diseñada para la precisión, nuestra calculadora DCF (300128SZ) le permite evaluar Suzhou Jinfu Technology Co., Ltd. Valoración utilizando datos financieros del mundo real, que ofrece una flexibilidad completa para modificar todos los parámetros esenciales para las proyecciones mejoradas.
Discounted Cash Flow (DCF) - (USD MM)
| Year | AY1 2020 |
AY2 2021 |
AY3 2022 |
AY4 2023 |
AY5 2024 |
FY1 2025 |
FY2 2026 |
FY3 2027 |
FY4 2028 |
FY5 2029 |
|---|---|---|---|---|---|---|---|---|---|---|
| Revenue | 1,364.2 | 972.2 | 1,402.0 | 1,742.9 | 1,797.5 | 1,990.4 | 2,204.0 | 2,440.5 | 2,702.3 | 2,992.3 |
| Revenue Growth, % | 0 | -28.74 | 44.21 | 24.32 | 3.13 | 10.73 | 10.73 | 10.73 | 10.73 | 10.73 |
| EBITDA | 106.8 | -44.5 | 28.4 | -14.6 | -151.5 | -15.9 | -17.6 | -19.5 | -21.6 | -23.9 |
| EBITDA, % | 7.83 | -4.58 | 2.03 | -0.83853 | -8.43 | -0.79754 | -0.79754 | -0.79754 | -0.79754 | -0.79754 |
| Depreciation | 44.2 | 43.3 | 77.0 | 111.8 | 124.9 | 105.7 | 117.0 | 129.6 | 143.5 | 158.9 |
| Depreciation, % | 3.24 | 4.45 | 5.49 | 6.42 | 6.95 | 5.31 | 5.31 | 5.31 | 5.31 | 5.31 |
| EBIT | 62.6 | -87.8 | -48.6 | -126.4 | -276.4 | -121.6 | -134.6 | -149.1 | -165.0 | -182.8 |
| EBIT, % | 4.59 | -9.03 | -3.46 | -7.25 | -15.38 | -6.11 | -6.11 | -6.11 | -6.11 | -6.11 |
| Total Cash | 331.4 | 312.5 | 355.7 | 636.6 | 345.8 | 547.6 | 606.4 | 671.5 | 743.5 | 823.3 |
| Total Cash, percent | .0 | .0 | .0 | .0 | .0 | .0 | .0 | .0 | .0 | .0 |
| Account Receivables | 512.5 | 412.1 | 608.5 | 906.4 | 1,010.8 | 921.9 | 1,020.9 | 1,130.4 | 1,251.7 | 1,386.0 |
| Account Receivables, % | 37.57 | 42.39 | 43.4 | 52 | 56.23 | 46.32 | 46.32 | 46.32 | 46.32 | 46.32 |
| Inventories | 156.0 | 132.7 | 259.0 | 325.9 | 379.4 | 331.8 | 367.4 | 406.9 | 450.5 | 498.9 |
| Inventories, % | 11.44 | 13.65 | 18.48 | 18.7 | 21.11 | 16.67 | 16.67 | 16.67 | 16.67 | 16.67 |
| Accounts Payable | 242.8 | 437.6 | 584.6 | 551.5 | 677.2 | 692.0 | 766.2 | 848.4 | 939.5 | 1,040.3 |
| Accounts Payable, % | 17.8 | 45.02 | 41.7 | 31.64 | 37.68 | 34.77 | 34.77 | 34.77 | 34.77 | 34.77 |
| Capital Expenditure | -47.3 | -47.6 | -127.1 | -392.7 | -148.1 | -191.9 | -212.4 | -235.2 | -260.5 | -288.4 |
| Capital Expenditure, % | -3.47 | -4.9 | -9.07 | -22.53 | -8.24 | -9.64 | -9.64 | -9.64 | -9.64 | -9.64 |
| Tax Rate, % | 5.14 | 5.14 | 5.14 | 5.14 | 5.14 | 5.14 | 5.14 | 5.14 | 5.14 | 5.14 |
| EBITAT | 42.9 | -107.0 | -55.1 | -178.0 | -262.2 | -112.7 | -124.7 | -138.1 | -152.9 | -169.4 |
| Depreciation | ||||||||||
| Changes in Account Receivables | ||||||||||
| Changes in Inventories | ||||||||||
| Changes in Accounts Payable | ||||||||||
| Capital Expenditure | ||||||||||
| UFCF | -386.0 | 207.2 | -281.0 | -856.7 | -317.5 | -47.7 | -280.4 | -310.5 | -343.9 | -380.8 |
| WACC, % | 5.2 | 5.48 | 5.48 | 5.48 | 5.44 | 5.42 | 5.42 | 5.42 | 5.42 | 5.42 |
| PV UFCF | ||||||||||
| SUM PV UFCF | -1,133.6 | |||||||||
| Long Term Growth Rate, % | 2.00 | |||||||||
| Free cash flow (T + 1) | -388 | |||||||||
| Terminal Value | -11,363 | |||||||||
| Present Terminal Value | -8,728 | |||||||||
| Enterprise Value | -9,862 | |||||||||
| Net Debt | 683 | |||||||||
| Equity Value | -10,545 | |||||||||
| Diluted Shares Outstanding, MM | 1,273 | |||||||||
| Equity Value Per Share | -8.28 |
What You Will Receive
- Authentic 300128SZ Financial Data: Access to both historical and projected figures for precise valuation.
- Customizable Inputs: Adjust parameters such as WACC, tax rates, revenue growth, and capital expenditures.
- Real-Time Calculations: Intrinsic value and NPV are calculated automatically.
- Scenario Analysis: Evaluate various scenarios to assess the future performance of Suzhou Jinfu Technology Co., Ltd.
- User-Friendly and Modern Design: Crafted for professionals, yet easy for newcomers to navigate.
Key Features
- 🔍 Real-Life 300128SZ Financials: Pre-loaded historical and projected data for Suzhou Jinfu Technology Co., Ltd.
- ✏️ Fully Customizable Inputs: Modify all essential parameters (yellow cells) such as WACC, growth %, and tax rates.
- 📊 Professional DCF Valuation: Integrated formulas compute the intrinsic value of Suzhou Jinfu Technology using the Discounted Cash Flow method.
- ⚡ Instant Results: View Suzhou Jinfu's valuation immediately after adjustments are made.
- Scenario Analysis: Explore and compare outcomes based on different financial assumptions side-by-side.
How It Functions
- Step 1: Download the Excel file.
- Step 2: Examine the pre-filled data for Suzhou Jinfu Technology Co., Ltd. (300128SZ).
- Step 3: Modify the key assumptions (highlighted in yellow) according to your analysis.
- Step 4: Observe automatic recalculations for the intrinsic value of Suzhou Jinfu Technology Co., Ltd. (300128SZ).
- Step 5: Utilize the results for investment analysis or reporting purposes.
Why Opt for Suzhou Jinfu Technology Co., Ltd. [300128SZ] Calculator?
- All-in-One Solution: Combines DCF, WACC, and financial ratio analyses seamlessly.
- Flexible Input Options: Modify yellow-highlighted fields to explore different scenarios.
- In-Depth Analysis: Automatically computes Suzhou Jinfu’s intrinsic value and Net Present Value.
- Data-Rich Environment: Comes with historical and projected data for precise analysis.
- High-Quality Standards: Perfect for financial analysts, investors, and business consultants.
Who Can Benefit from This Product?
- Institutional Investors: Develop comprehensive and reliable valuation models for analyzing portfolios featuring Suzhou Jinfu Technology Co., Ltd. (300128SZ).
- Corporate Finance Departments: Evaluate valuation scenarios to inform strategic decision-making within their organizations.
- Consultants and Financial Advisors: Offer clients precise valuation insights related to Suzhou Jinfu Technology Co., Ltd. (300128SZ).
- Academics and Students: Leverage real-world data to enhance learning and practice in financial modeling.
- Technology Enthusiasts: Gain a deeper understanding of how technology firms like Suzhou Jinfu Technology Co., Ltd. (300128SZ) are valued in the market.
Contents of the Template
- Operating and Balance Sheet Data: Pre-populated historical data and forecasts for Suzhou Jinfu Technology Co., Ltd. (300128SZ), including metrics such as revenue, EBITDA, EBIT, and capital expenditures.
- WACC Calculation: A dedicated sheet for computing the Weighted Average Cost of Capital (WACC), incorporating elements like Beta, risk-free rate, and stock price.
- DCF Valuation (Unlevered and Levered): Customizable Discounted Cash Flow models presenting intrinsic value along with comprehensive calculations.
- Financial Statements: Pre-loaded annual and quarterly financial statements for effective analysis.
- Key Ratios: Includes profitability, leverage, and efficiency ratios relevant to Suzhou Jinfu Technology Co., Ltd. (300128SZ).
- Dashboard and Charts: Visual representations of valuation results and underlying assumptions to facilitate easy analysis.
Disclaimer
All information, articles, and product details provided on this website are for general informational and educational purposes only. We do not claim any ownership over, nor do we intend to infringe upon, any trademarks, copyrights, logos, brand names, or other intellectual property mentioned or depicted on this site. Such intellectual property remains the property of its respective owners, and any references here are made solely for identification or informational purposes, without implying any affiliation, endorsement, or partnership.
We make no representations or warranties, express or implied, regarding the accuracy, completeness, or suitability of any content or products presented. Nothing on this website should be construed as legal, tax, investment, financial, medical, or other professional advice. In addition, no part of this site—including articles or product references—constitutes a solicitation, recommendation, endorsement, advertisement, or offer to buy or sell any securities, franchises, or other financial instruments, particularly in jurisdictions where such activity would be unlawful.
All content is of a general nature and may not address the specific circumstances of any individual or entity. It is not a substitute for professional advice or services. Any actions you take based on the information provided here are strictly at your own risk. You accept full responsibility for any decisions or outcomes arising from your use of this website and agree to release us from any liability in connection with your use of, or reliance upon, the content or products found herein.