
|
Shenzhen Sunway Communication Co., Ltd. (300136.sz) Valoración de DCF |
Completamente Editable: Adáptelo A Sus Necesidades En Excel O Sheets
Diseño Profesional: Plantillas Confiables Y Estándares De La Industria
Predeterminadas Para Un Uso Rápido Y Eficiente
Compatible con MAC / PC, completamente desbloqueado
No Se Necesita Experiencia; Fáciles De Seguir
Shenzhen Sunway Communication Co., Ltd. (300136.SZ) Bundle
¡Mejore su estrategia de inversión con la calculadora DCF (300136SZ)! Utilice datos financieros reales de Shenzhen Sunway Communication Co., Ltd., ajuste las proyecciones y gastos de crecimiento, y observe instantáneamente cómo estas modificaciones afectan el valor intrínseco de (300136SZ).
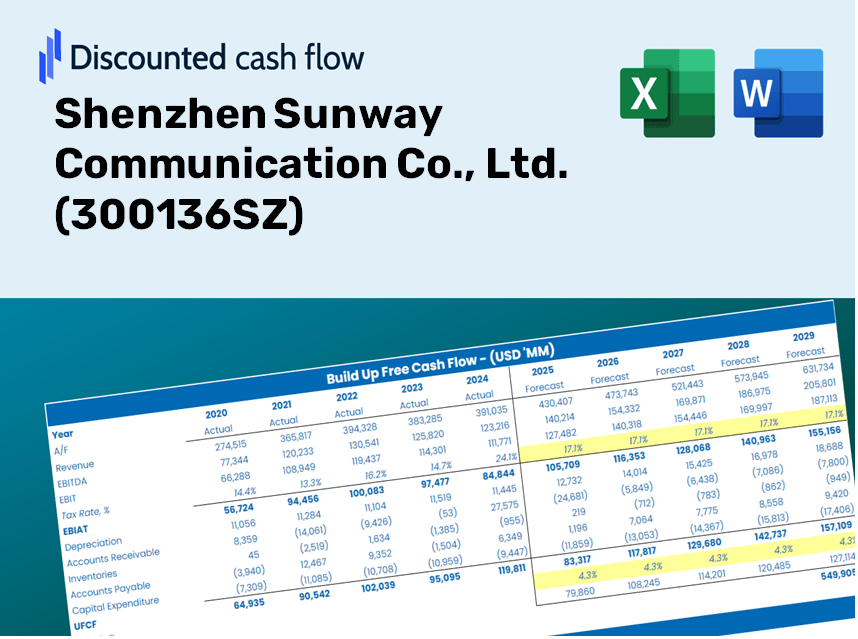
Discounted Cash Flow (DCF) - (USD MM)
| Year | AY1 2020 |
AY2 2021 |
AY3 2022 |
AY4 2023 |
AY5 2024 |
FY1 2025 |
FY2 2026 |
FY3 2027 |
FY4 2028 |
FY5 2029 |
|---|---|---|---|---|---|---|---|---|---|---|
| Revenue | 6,393.6 | 7,581.4 | 8,589.9 | 7,547.6 | 8,743.6 | 9,521.6 | 10,368.8 | 11,291.4 | 12,296.1 | 13,390.2 |
| Revenue Growth, % | 0 | 18.58 | 13.3 | -12.13 | 15.85 | 8.9 | 8.9 | 8.9 | 8.9 | 8.9 |
| EBITDA | 1,517.0 | 1,097.7 | 1,403.8 | 1,146.3 | 1,401.7 | 1,633.3 | 1,778.6 | 1,936.9 | 2,109.2 | 2,296.9 |
| EBITDA, % | 23.73 | 14.48 | 16.34 | 15.19 | 16.03 | 17.15 | 17.15 | 17.15 | 17.15 | 17.15 |
| Depreciation | 356.5 | 572.8 | 649.9 | 530.1 | 589.0 | 656.2 | 714.5 | 778.1 | 847.4 | 922.8 |
| Depreciation, % | 5.58 | 7.56 | 7.57 | 7.02 | 6.74 | 6.89 | 6.89 | 6.89 | 6.89 | 6.89 |
| EBIT | 1,160.6 | 524.9 | 753.9 | 616.2 | 812.7 | 977.1 | 1,064.1 | 1,158.7 | 1,261.8 | 1,374.1 |
| EBIT, % | 18.15 | 6.92 | 8.78 | 8.16 | 9.29 | 10.26 | 10.26 | 10.26 | 10.26 | 10.26 |
| Total Cash | 1,759.2 | 1,820.3 | 1,779.5 | 2,001.8 | 1,603.0 | 2,229.9 | 2,428.3 | 2,644.4 | 2,879.6 | 3,135.9 |
| Total Cash, percent | .0 | .0 | .0 | .0 | .0 | .0 | .0 | .0 | .0 | .0 |
| Account Receivables | 2,488.0 | 2,333.9 | 2,467.5 | 2,205.2 | 2,496.2 | 2,974.3 | 3,239.0 | 3,527.2 | 3,841.0 | 4,182.8 |
| Account Receivables, % | 38.91 | 30.78 | 28.73 | 29.22 | 28.55 | 31.24 | 31.24 | 31.24 | 31.24 | 31.24 |
| Inventories | 2,175.6 | 2,439.7 | 2,370.6 | 2,239.9 | 1,393.4 | 2,655.0 | 2,891.2 | 3,148.4 | 3,428.6 | 3,733.7 |
| Inventories, % | 34.03 | 32.18 | 27.6 | 29.68 | 15.94 | 27.88 | 27.88 | 27.88 | 27.88 | 27.88 |
| Accounts Payable | 2,153.3 | 2,175.6 | 1,991.0 | 1,762.7 | 2,023.0 | 2,514.5 | 2,738.3 | 2,981.9 | 3,247.3 | 3,536.2 |
| Accounts Payable, % | 33.68 | 28.7 | 23.18 | 23.35 | 23.14 | 26.41 | 26.41 | 26.41 | 26.41 | 26.41 |
| Capital Expenditure | -916.8 | -1,304.6 | -712.0 | -589.7 | -1,084.8 | -1,143.7 | -1,245.4 | -1,356.2 | -1,476.9 | -1,608.3 |
| Capital Expenditure, % | -14.34 | -17.21 | -8.29 | -7.81 | -12.41 | -12.01 | -12.01 | -12.01 | -12.01 | -12.01 |
| Tax Rate, % | 9.08 | 9.08 | 9.08 | 9.08 | 9.08 | 9.08 | 9.08 | 9.08 | 9.08 | 9.08 |
| EBITAT | 1,036.4 | 543.3 | 718.0 | 560.2 | 738.8 | 911.4 | 992.5 | 1,080.8 | 1,177.0 | 1,281.7 |
| Depreciation | ||||||||||
| Changes in Account Receivables | ||||||||||
| Changes in Inventories | ||||||||||
| Changes in Accounts Payable | ||||||||||
| Capital Expenditure | ||||||||||
| UFCF | -2,034.2 | -276.2 | 406.8 | 665.4 | 1,058.9 | -824.3 | 184.5 | 200.9 | 218.8 | 238.3 |
| WACC, % | 4.82 | 4.86 | 4.84 | 4.82 | 4.82 | 4.83 | 4.83 | 4.83 | 4.83 | 4.83 |
| PV UFCF | ||||||||||
| SUM PV UFCF | -74.7 | |||||||||
| Long Term Growth Rate, % | 3.50 | |||||||||
| Free cash flow (T + 1) | 247 | |||||||||
| Terminal Value | 18,504 | |||||||||
| Present Terminal Value | 14,615 | |||||||||
| Enterprise Value | 14,540 | |||||||||
| Net Debt | 1,176 | |||||||||
| Equity Value | 13,364 | |||||||||
| Diluted Shares Outstanding, MM | 964 | |||||||||
| Equity Value Per Share | 13.87 |
What You Will Receive
- Pre-Filled Financial Model: Leverage Shenzhen Sunway Communication Co., Ltd.'s (300136SZ) actual data for accurate DCF valuation.
- Comprehensive Forecast Control: Modify revenue growth rates, profit margins, WACC, and other essential metrics.
- Real-Time Calculations: Automatic updates provide immediate feedback as you make adjustments.
- Professional-Grade Template: A polished Excel model crafted for high-quality valuation.
- Customizable and Reusable: Designed for versatility, allowing for repeated application in detailed forecasting.
Key Features
- Genuine Shenzhen Sunway Financial Data: Gain access to reliable historical data and future forecasts.
- Tailorable Forecast Parameters: Modify yellow-highlighted fields such as WACC, growth rates, and profit margins.
- Real-Time Calculations: Automatic adjustments to DCF, Net Present Value (NPV), and cash flow assessments.
- Interactive Dashboard: Clear charts and summaries designed to help you understand your valuation outcomes.
- Suitable for All Levels: A user-friendly layout tailored for investors, CFOs, and consultants alike.
How It Functions
- Download the Template: Gain immediate access to the Excel-based Shenzhen Sunway Communication DCF Calculator (300136SZ).
- Input Your Assumptions: Modify the highlighted cells in yellow to set growth rates, WACC, margins, and other variables.
- Instant Calculations: The model automatically computes the intrinsic value of Shenzhen Sunway Communication.
- Test Scenarios: Explore various assumptions to assess changes in valuation outcomes.
- Analyze and Decide: Utilize the findings to inform your investment or financial evaluation.
Why Select Sunway Communication's Calculator?
- Precision: Utilizes verified financial data for unmatched accuracy.
- Adaptability: Tailored for users to easily experiment with and adjust inputs.
- Efficiency: Avoid the complexities of constructing a DCF model from the ground up.
- Expert-Level: Crafted with the insights and usability expected by industry leaders.
- Intuitive: Simple interface designed for users of all financial backgrounds.
Who Can Benefit from This Product?
- Individual Investors: Gain insights for making informed decisions about trading Shenzhen Sunway Communication Co., Ltd. (300136SZ) stock.
- Financial Analysts: Enhance valuation processes with accessible financial models tailored for Shenzhen Sunway Communication Co., Ltd. (300136SZ).
- Consultants: Provide clients with accurate valuation analyses related to Shenzhen Sunway Communication Co., Ltd. (300136SZ) in a timely manner.
- Business Owners: Learn how the valuation of major firms like Shenzhen Sunway Communication Co., Ltd. (300136SZ) can inform your business strategies.
- Finance Students: Master valuation methods using real data and case studies from Shenzhen Sunway Communication Co., Ltd. (300136SZ).
Overview of the Template Contents
- Operating and Balance Sheet Data: Pre-filled historical data and forecasts for Shenzhen Sunway Communication Co., Ltd. (300136SZ), including revenue, EBITDA, EBIT, and capital expenditures.
- WACC Calculation: A dedicated sheet for Weighted Average Cost of Capital (WACC), featuring parameters such as Beta, risk-free rate, and share price.
- DCF Valuation (Unlevered and Levered): Customizable Discounted Cash Flow models that detail intrinsic value calculations.
- Financial Statements: Pre-loaded annual and quarterly financial statements to facilitate thorough analysis.
- Key Ratios: A collection of profitability, leverage, and efficiency ratios specifically for Shenzhen Sunway Communication Co., Ltd. (300136SZ).
- Dashboard and Charts: Visual representations of valuation outputs and assumptions for easy result analysis.
Disclaimer
All information, articles, and product details provided on this website are for general informational and educational purposes only. We do not claim any ownership over, nor do we intend to infringe upon, any trademarks, copyrights, logos, brand names, or other intellectual property mentioned or depicted on this site. Such intellectual property remains the property of its respective owners, and any references here are made solely for identification or informational purposes, without implying any affiliation, endorsement, or partnership.
We make no representations or warranties, express or implied, regarding the accuracy, completeness, or suitability of any content or products presented. Nothing on this website should be construed as legal, tax, investment, financial, medical, or other professional advice. In addition, no part of this site—including articles or product references—constitutes a solicitation, recommendation, endorsement, advertisement, or offer to buy or sell any securities, franchises, or other financial instruments, particularly in jurisdictions where such activity would be unlawful.
All content is of a general nature and may not address the specific circumstances of any individual or entity. It is not a substitute for professional advice or services. Any actions you take based on the information provided here are strictly at your own risk. You accept full responsibility for any decisions or outcomes arising from your use of this website and agree to release us from any liability in connection with your use of, or reliance upon, the content or products found herein.