
|
CECEP Environmental Protection Equipment Co., Ltd. (300140.sz) Valoración de DCF |
Completamente Editable: Adáptelo A Sus Necesidades En Excel O Sheets
Diseño Profesional: Plantillas Confiables Y Estándares De La Industria
Predeterminadas Para Un Uso Rápido Y Eficiente
Compatible con MAC / PC, completamente desbloqueado
No Se Necesita Experiencia; Fáciles De Seguir
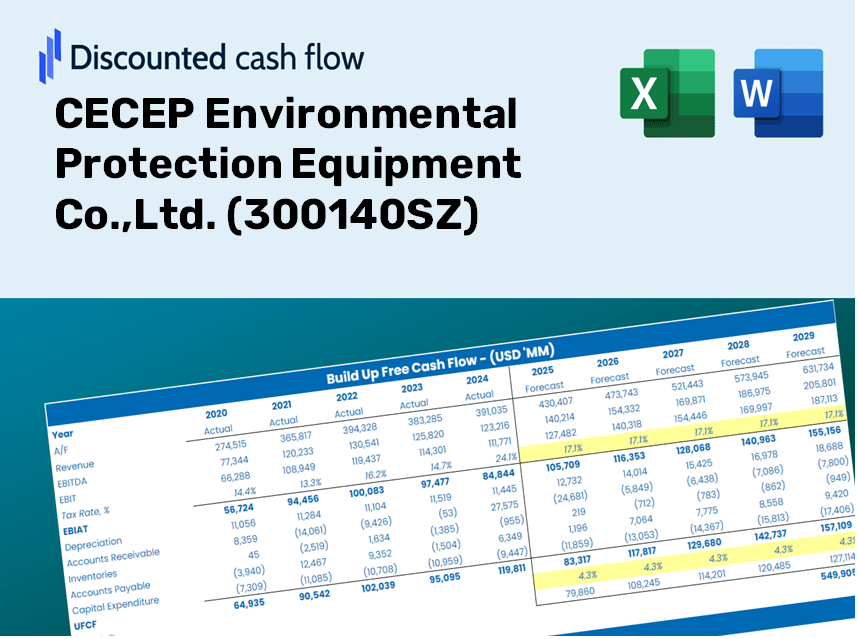
CECEP Environmental Protection Equipment Co.,Ltd. (300140.SZ) Bundle
¡Descubra el verdadero potencial de CECEP Environmental Protection Equipment Co., Ltd. con nuestra calculadora DCF avanzada! Ajuste los supuestos críticos, explore varios escenarios y examine cómo las modificaciones afectan CECEP Ambient Protection Equipment Co., Ltd. Valoración: todo dentro de una plantilla integral de Excel.
Discounted Cash Flow (DCF) - (USD MM)
| Year | AY1 2020 |
AY2 2021 |
AY3 2022 |
AY4 2023 |
AY5 2024 |
FY1 2025 |
FY2 2026 |
FY3 2027 |
FY4 2028 |
FY5 2029 |
|---|---|---|---|---|---|---|---|---|---|---|
| Revenue | 1,883.6 | 1,134.1 | 6,396.3 | 6,144.7 | 5,919.3 | 6,697.9 | 7,578.8 | 8,575.6 | 9,703.5 | 10,979.7 |
| Revenue Growth, % | 0 | -39.79 | 463.99 | -3.93 | -3.67 | 13.15 | 13.15 | 13.15 | 13.15 | 13.15 |
| EBITDA | -150.3 | -107.6 | 2,438.3 | 2,494.3 | 2,520.3 | 1,390.8 | 1,573.7 | 1,780.7 | 2,014.9 | 2,279.9 |
| EBITDA, % | -7.98 | -9.48 | 38.12 | 40.59 | 42.58 | 20.76 | 20.76 | 20.76 | 20.76 | 20.76 |
| Depreciation | 90.7 | 39.3 | 1,057.1 | 1,125.0 | 1,158.3 | 839.7 | 950.2 | 1,075.1 | 1,216.5 | 1,376.5 |
| Depreciation, % | 4.82 | 3.46 | 16.53 | 18.31 | 19.57 | 12.54 | 12.54 | 12.54 | 12.54 | 12.54 |
| EBIT | -241.1 | -146.9 | 1,381.2 | 1,369.2 | 1,362.0 | 551.1 | 623.6 | 705.6 | 798.4 | 903.4 |
| EBIT, % | -12.8 | -12.95 | 21.59 | 22.28 | 23.01 | 8.23 | 8.23 | 8.23 | 8.23 | 8.23 |
| Total Cash | 548.7 | 753.2 | 401.2 | 5,603.7 | 2,064.2 | 3,052.7 | 3,454.2 | 3,908.5 | 4,422.6 | 5,004.2 |
| Total Cash, percent | .0 | .0 | .0 | .0 | .0 | .0 | .0 | .0 | .0 | .0 |
| Account Receivables | 2,676.2 | 1,093.5 | .0 | 5,099.9 | 5,891.0 | 5,076.1 | 5,743.8 | 6,499.2 | 7,354.0 | 8,321.2 |
| Account Receivables, % | 142.08 | 96.42 | 0 | 83 | 99.52 | 75.79 | 75.79 | 75.79 | 75.79 | 75.79 |
| Inventories | 436.7 | 398.0 | 428.2 | 471.3 | 543.3 | 1,096.0 | 1,240.2 | 1,403.3 | 1,587.8 | 1,796.7 |
| Inventories, % | 23.19 | 35.09 | 6.69 | 7.67 | 9.18 | 16.36 | 16.36 | 16.36 | 16.36 | 16.36 |
| Accounts Payable | 392.7 | 520.1 | 3,418.5 | 2,841.5 | 2,543.1 | 2,804.5 | 3,173.4 | 3,590.7 | 4,063.0 | 4,597.4 |
| Accounts Payable, % | 20.85 | 45.86 | 53.44 | 46.24 | 42.96 | 41.87 | 41.87 | 41.87 | 41.87 | 41.87 |
| Capital Expenditure | -64.2 | -26.9 | -8.5 | -1,438.1 | -713.7 | -554.2 | -627.1 | -709.6 | -802.9 | -908.5 |
| Capital Expenditure, % | -3.41 | -2.37 | -0.13336 | -23.4 | -12.06 | -8.27 | -8.27 | -8.27 | -8.27 | -8.27 |
| Tax Rate, % | 28.4 | 28.4 | 28.4 | 28.4 | 28.4 | 28.4 | 28.4 | 28.4 | 28.4 | 28.4 |
| EBITAT | -251.3 | -137.8 | 1,140.2 | 1,176.0 | 975.2 | 478.2 | 541.1 | 612.3 | 692.8 | 783.9 |
| Depreciation | ||||||||||
| Changes in Account Receivables | ||||||||||
| Changes in Inventories | ||||||||||
| Changes in Accounts Payable | ||||||||||
| Capital Expenditure | ||||||||||
| UFCF | -2,945.0 | 1,623.5 | 6,150.4 | -4,857.2 | 258.3 | 1,287.3 | 421.2 | 476.6 | 539.3 | 610.2 |
| WACC, % | 5.02 | 4.91 | 4.71 | 4.77 | 4.52 | 4.79 | 4.79 | 4.79 | 4.79 | 4.79 |
| PV UFCF | ||||||||||
| SUM PV UFCF | 2,956.7 | |||||||||
| Long Term Growth Rate, % | 2.00 | |||||||||
| Free cash flow (T + 1) | 622 | |||||||||
| Terminal Value | 22,335 | |||||||||
| Present Terminal Value | 17,679 | |||||||||
| Enterprise Value | 20,636 | |||||||||
| Net Debt | 5,087 | |||||||||
| Equity Value | 15,549 | |||||||||
| Diluted Shares Outstanding, MM | 3,110 | |||||||||
| Equity Value Per Share | 5.00 |
What You Will Receive
- Genuine CECEP Data: Preloaded financial metrics – covering everything from revenue to EBIT – derived from actual and forecasted figures.
- Comprehensive Customization: Modify all key parameters (highlighted cells) like WACC, growth %, and tax rates.
- Real-Time Valuation Updates: Automatic recalculations to assess the effects of changes on CECEP's fair value.
- Flexible Excel Template: Designed for quick modifications, scenario analysis, and in-depth projections.
- Efficient and Precise: Bypass the need to create models from scratch while ensuring accuracy and adaptability.
Key Features
- Pre-Loaded Data: CECEP Environmental Protection Equipment Co., Ltd.'s historical financial statements and pre-filled forecasts.
- Fully Adjustable Inputs: Modify WACC, tax rates, revenue growth, and EBITDA margins as needed.
- Instant Results: View CECEP's intrinsic value recalculated in real time.
- Clear Visual Outputs: Dashboard charts present valuation results and essential metrics.
- Built for Accuracy: A professional-grade tool designed for analysts, investors, and finance specialists.
How It Works
- Download: Obtain the pre-configured Excel file featuring CECEP Environmental Protection Equipment Co.,Ltd.'s (300140SZ) financial information.
- Customize: Tailor your forecasts, including revenue growth, EBITDA percentage, and WACC.
- Update Automatically: Enjoy real-time updates for intrinsic value and NPV calculations.
- Test Scenarios: Generate various projections and instantly compare the outcomes.
- Make Decisions: Leverage the valuation results to inform your investment strategy.
Why Opt for CECEP Environmental Protection Equipment Co.,Ltd. Calculator?
- Designed for Experts: A sophisticated tool favored by industry analysts, CFOs, and consultants.
- Comprehensive Data: CECEP’s historical and projected financials preloaded for enhanced accuracy.
- Versatile Scenario Testing: Easily simulate various forecasts and assumptions.
- Concise Results: Instantly calculates intrinsic value, NPV, and essential metrics.
- User-Friendly: Step-by-step guidance simplifies the process for all users.
Who Can Benefit from This Product?
- Investors: Assess CECEP Environmental Protection Equipment Co., Ltd.’s (300140SZ) valuation for informed stock trading decisions.
- CFOs and Financial Analysts: Enhance valuation workflows and evaluate financial forecasts.
- Startup Founders: Understand the valuation methodologies used for prominent companies like CECEP Environmental Protection Equipment Co., Ltd. (300140SZ).
- Consultants: Provide accurate valuation reports for your clients’ needs.
- Students and Educators: Utilize real-world case studies to teach and apply valuation strategies.
Contents of the Template
- Pre-Filled Data: Features CECEP Environmental Protection Equipment Co., Ltd.'s historical financial information and projections.
- Discounted Cash Flow Model: An editable DCF valuation model complete with automatic calculations.
- Weighted Average Cost of Capital (WACC): A specific sheet for calculating WACC using custom inputs.
- Key Financial Ratios: Evaluate CECEP's profitability, operational efficiency, and financial leverage.
- Customizable Inputs: Easily adjust revenue growth rates, profit margins, and tax rates.
- Clear Dashboard: Visual representations and tables summarizing essential valuation outcomes.
Disclaimer
All information, articles, and product details provided on this website are for general informational and educational purposes only. We do not claim any ownership over, nor do we intend to infringe upon, any trademarks, copyrights, logos, brand names, or other intellectual property mentioned or depicted on this site. Such intellectual property remains the property of its respective owners, and any references here are made solely for identification or informational purposes, without implying any affiliation, endorsement, or partnership.
We make no representations or warranties, express or implied, regarding the accuracy, completeness, or suitability of any content or products presented. Nothing on this website should be construed as legal, tax, investment, financial, medical, or other professional advice. In addition, no part of this site—including articles or product references—constitutes a solicitation, recommendation, endorsement, advertisement, or offer to buy or sell any securities, franchises, or other financial instruments, particularly in jurisdictions where such activity would be unlawful.
All content is of a general nature and may not address the specific circumstances of any individual or entity. It is not a substitute for professional advice or services. Any actions you take based on the information provided here are strictly at your own risk. You accept full responsibility for any decisions or outcomes arising from your use of this website and agree to release us from any liability in connection with your use of, or reliance upon, the content or products found herein.