
|
Xiangxue Pharmaceutical Co., Ltd. (300147.sz) Valoración de DCF |
Completamente Editable: Adáptelo A Sus Necesidades En Excel O Sheets
Diseño Profesional: Plantillas Confiables Y Estándares De La Industria
Predeterminadas Para Un Uso Rápido Y Eficiente
Compatible con MAC / PC, completamente desbloqueado
No Se Necesita Experiencia; Fáciles De Seguir
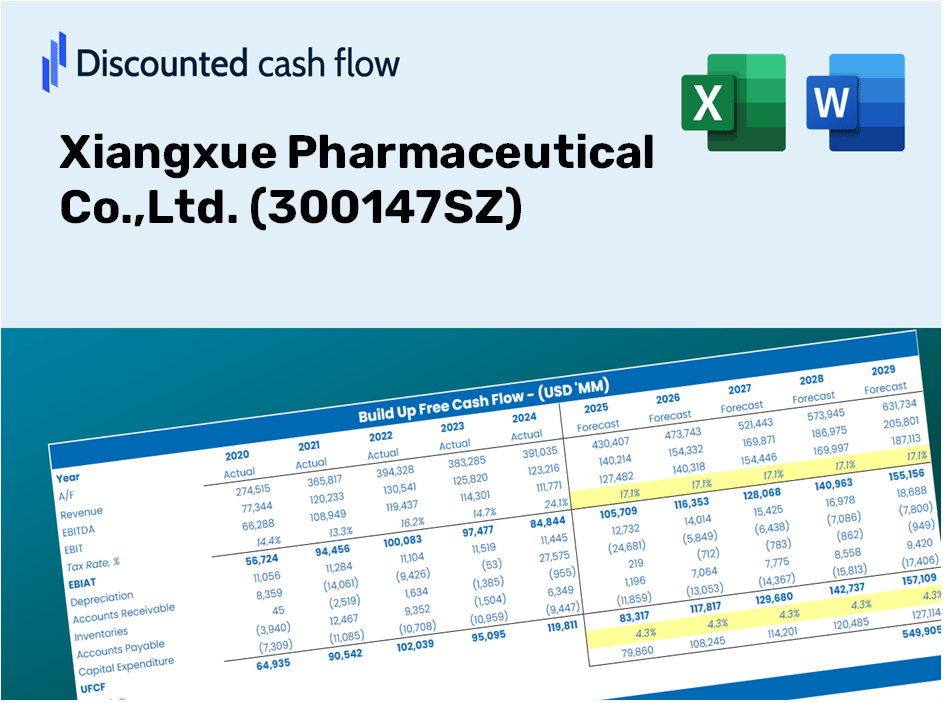
Xiangxue Pharmaceutical Co.,Ltd. (300147.SZ) Bundle
¡Descubra el verdadero valor de Xiangxue Pharmaceutical Co., Ltd. con nuestra calculadora DCF de grado profesional! Ajuste los supuestos clave, explore varios escenarios y evalúe cómo los cambios afectan a Xiangxue Pharmaceutical Co., Ltd. Valoración: todo dentro de una sola plantilla de Excel.
Discounted Cash Flow (DCF) - (USD MM)
| Year | AY1 2020 |
AY2 2021 |
AY3 2022 |
AY4 2023 |
AY5 2024 |
FY1 2025 |
FY2 2026 |
FY3 2027 |
FY4 2028 |
FY5 2029 |
|---|---|---|---|---|---|---|---|---|---|---|
| Revenue | 3,072.1 | 2,970.6 | 2,187.1 | 2,299.3 | 1,858.7 | 1,655.5 | 1,474.6 | 1,313.5 | 1,169.9 | 1,042.1 |
| Revenue Growth, % | 0 | -3.3 | -26.38 | 5.13 | -19.16 | -10.93 | -10.93 | -10.93 | -10.93 | -10.93 |
| EBITDA | 447.2 | 125.0 | 60.3 | 282.2 | -15.7 | 109.1 | 97.2 | 86.6 | 77.1 | 68.7 |
| EBITDA, % | 14.56 | 4.21 | 2.76 | 12.27 | -0.8449 | 6.59 | 6.59 | 6.59 | 6.59 | 6.59 |
| Depreciation | 135.3 | 147.4 | 235.6 | 232.5 | 218.2 | 139.0 | 123.9 | 110.3 | 98.3 | 87.5 |
| Depreciation, % | 4.4 | 4.96 | 10.77 | 10.11 | 11.74 | 8.4 | 8.4 | 8.4 | 8.4 | 8.4 |
| EBIT | 311.8 | -22.4 | -175.3 | 49.7 | -233.9 | -30.0 | -26.7 | -23.8 | -21.2 | -18.9 |
| EBIT, % | 10.15 | -0.75386 | -8.02 | 2.16 | -12.59 | -1.81 | -1.81 | -1.81 | -1.81 | -1.81 |
| Total Cash | 624.5 | 261.7 | 166.6 | 149.3 | 144.7 | 169.0 | 150.5 | 134.1 | 119.4 | 106.4 |
| Total Cash, percent | .0 | .0 | .0 | .0 | .0 | .0 | .0 | .0 | .0 | .0 |
| Account Receivables | 1,226.3 | 1,566.5 | 778.2 | 847.0 | 901.8 | 707.2 | 629.9 | 561.1 | 499.8 | 445.1 |
| Account Receivables, % | 39.92 | 52.73 | 35.58 | 36.84 | 48.52 | 42.72 | 42.72 | 42.72 | 42.72 | 42.72 |
| Inventories | 839.8 | 761.5 | 467.1 | 411.3 | 340.9 | 366.1 | 326.1 | 290.4 | 258.7 | 230.4 |
| Inventories, % | 27.34 | 25.63 | 21.36 | 17.89 | 18.34 | 22.11 | 22.11 | 22.11 | 22.11 | 22.11 |
| Accounts Payable | 801.0 | 1,299.8 | 988.9 | 1,087.2 | 1,153.8 | 743.1 | 661.9 | 589.5 | 525.1 | 467.7 |
| Accounts Payable, % | 26.07 | 43.76 | 45.22 | 47.29 | 62.08 | 44.88 | 44.88 | 44.88 | 44.88 | 44.88 |
| Capital Expenditure | -707.4 | -562.7 | -367.3 | -56.0 | -35.2 | -208.9 | -186.1 | -165.8 | -147.6 | -131.5 |
| Capital Expenditure, % | -23.03 | -18.94 | -16.79 | -2.44 | -1.9 | -12.62 | -12.62 | -12.62 | -12.62 | -12.62 |
| Tax Rate, % | -1.96 | -1.96 | -1.96 | -1.96 | -1.96 | -1.96 | -1.96 | -1.96 | -1.96 | -1.96 |
| EBITAT | 184.7 | -24.2 | -181.6 | 49.7 | -238.5 | -27.5 | -24.5 | -21.8 | -19.4 | -17.3 |
| Depreciation | ||||||||||
| Changes in Account Receivables | ||||||||||
| Changes in Inventories | ||||||||||
| Changes in Accounts Payable | ||||||||||
| Capital Expenditure | ||||||||||
| UFCF | -1,652.4 | -202.6 | 458.6 | 311.4 | 26.7 | -338.8 | -50.7 | -45.1 | -40.2 | -35.8 |
| WACC, % | 5.76 | 6.8 | 6.8 | 6.8 | 6.8 | 6.59 | 6.59 | 6.59 | 6.59 | 6.59 |
| PV UFCF | ||||||||||
| SUM PV UFCF | -456.8 | |||||||||
| Long Term Growth Rate, % | 2.00 | |||||||||
| Free cash flow (T + 1) | -37 | |||||||||
| Terminal Value | -795 | |||||||||
| Present Terminal Value | -578 | |||||||||
| Enterprise Value | -1,035 | |||||||||
| Net Debt | 1,825 | |||||||||
| Equity Value | -2,859 | |||||||||
| Diluted Shares Outstanding, MM | 660 | |||||||||
| Equity Value Per Share | -4.33 |
Benefits You Will Enjoy
- Authentic Xiangxue Data: Comprehensive financials – including revenue and EBIT – derived from actual and projected data.
- Complete Customization: Modify all key parameters (yellow cells) such as WACC, growth %, and tax rates to suit your analysis.
- Real-Time Valuation Adjustments: Automatic updates to assess the effects of changes on the fair value of Xiangxue Pharmaceutical Co.,Ltd. (300147SZ).
- User-Friendly Excel Template: Designed for quick modifications, scenario analysis, and precise projections.
- Efficiency and Accuracy: Eliminate the need to create models from the ground up while ensuring precision and adaptability.
Key Features
- Pre-Loaded Data: Historical financial statements and pre-filled forecasts for Xiangxue Pharmaceutical Co.,Ltd. (300147SZ).
- Fully Adjustable Inputs: Customize WACC, tax rates, revenue growth, and EBITDA margins.
- Instant Results: View the intrinsic value of Xiangxue Pharmaceutical Co.,Ltd. (300147SZ) recalculating in real time.
- Clear Visual Outputs: Dashboard charts present valuation results and essential metrics.
- Built for Accuracy: A professional-grade tool designed for analysts, investors, and finance experts.
How It Operates
- Download the Template: Gain immediate access to the Excel-based Xiangxue Pharmaceutical DCF Calculator.
- Input Your Assumptions: Modify the yellow-highlighted cells for growth rates, WACC, profit margins, and other variables.
- Instant Calculations: The model will automatically refresh to reveal the intrinsic value of Xiangxue Pharmaceutical (300147SZ).
- Test Scenarios: Experiment with various assumptions to analyze potential valuation shifts.
- Analyze and Decide: Leverage the insights gained to inform your investment or financial evaluations.
Why Choose Xiangxue Pharmaceutical's Calculator?
- Precision: Utilizes accurate financial data from Xiangxue Pharmaceutical (300147SZ) for reliable results.
- Adaptability: Crafted to allow users to easily adjust and test various inputs.
- Efficient: Eliminate the complexities of creating a DCF model from the ground up.
- Expert-Level: Built with the precision and functionality expected by CFOs and finance professionals.
- Intuitive: Simple to navigate, making it accessible for users with limited financial modeling experience.
Who Can Benefit from Xiangxue Pharmaceutical Co., Ltd. (300147SZ)?
- Investors: Make informed investment choices with our advanced evaluation tools tailored for pharmaceutical markets.
- Financial Analysts: Enhance efficiency with our customizable financial models designed for the healthcare sector.
- Consultants: Streamline your workflow by adapting our resources for client reports and presentations.
- Pharmaceutical Enthusiasts: Expand your insights into industry-specific valuation methodologies with real-world applications.
- Educators and Students: Leverage our materials as a hands-on resource for finance and pharmaceutical studies.
Contents of the Template
- Pre-Filled Data: Contains Xiangxue Pharmaceutical Co., Ltd.'s historical financial information and future projections.
- Discounted Cash Flow Model: An editable DCF valuation model featuring automatic computation.
- Weighted Average Cost of Capital (WACC): A specific sheet for calculating WACC based on user-defined parameters.
- Key Financial Ratios: Evaluate Xiangxue Pharmaceutical's profitability, efficiency, and financial leverage.
- Customizable Inputs: Easily modify revenue growth, profit margins, and tax rates.
- Clear Dashboard: Visual presentations, including charts and tables that summarize essential valuation outcomes.
Disclaimer
All information, articles, and product details provided on this website are for general informational and educational purposes only. We do not claim any ownership over, nor do we intend to infringe upon, any trademarks, copyrights, logos, brand names, or other intellectual property mentioned or depicted on this site. Such intellectual property remains the property of its respective owners, and any references here are made solely for identification or informational purposes, without implying any affiliation, endorsement, or partnership.
We make no representations or warranties, express or implied, regarding the accuracy, completeness, or suitability of any content or products presented. Nothing on this website should be construed as legal, tax, investment, financial, medical, or other professional advice. In addition, no part of this site—including articles or product references—constitutes a solicitation, recommendation, endorsement, advertisement, or offer to buy or sell any securities, franchises, or other financial instruments, particularly in jurisdictions where such activity would be unlawful.
All content is of a general nature and may not address the specific circumstances of any individual or entity. It is not a substitute for professional advice or services. Any actions you take based on the information provided here are strictly at your own risk. You accept full responsibility for any decisions or outcomes arising from your use of this website and agree to release us from any liability in connection with your use of, or reliance upon, the content or products found herein.