
|
Anshan Senyuan Road and Bridge Co., Ltd (300210.SZ) Valoración de DCF |
Completamente Editable: Adáptelo A Sus Necesidades En Excel O Sheets
Diseño Profesional: Plantillas Confiables Y Estándares De La Industria
Predeterminadas Para Un Uso Rápido Y Eficiente
Compatible con MAC / PC, completamente desbloqueado
No Se Necesita Experiencia; Fáciles De Seguir
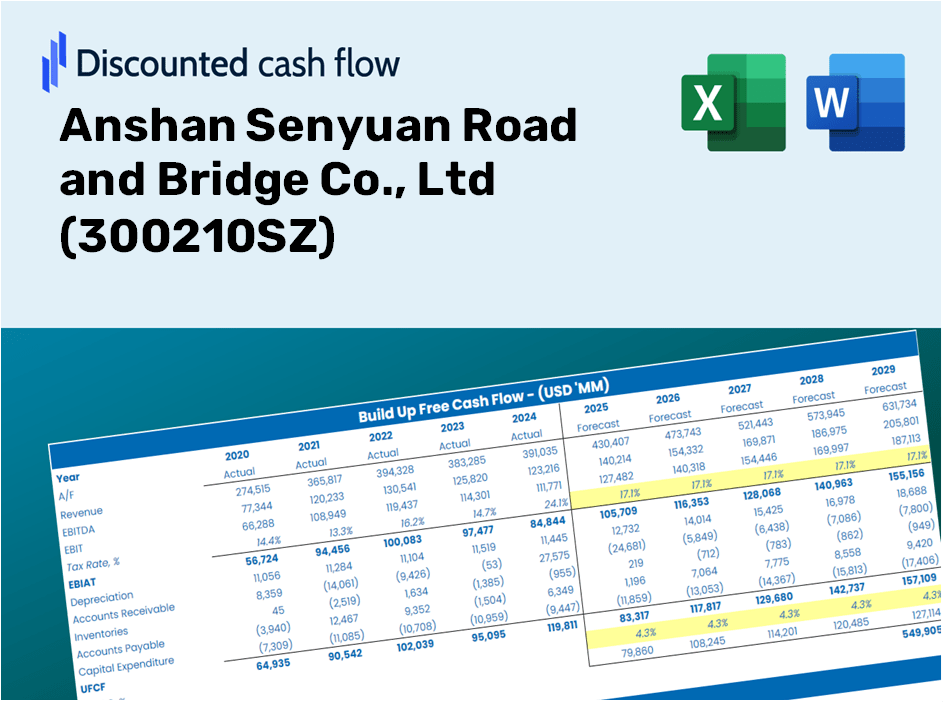
Anshan Senyuan Road and Bridge Co., Ltd (300210.SZ) Bundle
¡Explore el potencial financiero de Anshan Senyuan Road and Bridge Co., Ltd con nuestra calculadora DCF fácil de usar! Ingrese sus suposiciones con respecto al crecimiento, los márgenes y los gastos para calcular el valor intrínseco de Anshan Senyuan Road y Bridge Co., LTD y refinar su enfoque de inversión.
Discounted Cash Flow (DCF) - (USD MM)
| Year | AY1 2020 |
AY2 2021 |
AY3 2022 |
AY4 2023 |
AY5 2024 |
FY1 2025 |
FY2 2026 |
FY3 2027 |
FY4 2028 |
FY5 2029 |
|---|---|---|---|---|---|---|---|---|---|---|
| Revenue | 380.4 | 210.7 | 203.9 | 198.3 | 226.8 | 206.3 | 187.6 | 170.6 | 155.1 | 141.1 |
| Revenue Growth, % | 0 | -44.6 | -3.23 | -2.75 | 14.35 | -9.06 | -9.06 | -9.06 | -9.06 | -9.06 |
| EBITDA | 186.9 | -114.2 | -142.8 | -65.1 | 17.2 | -41.4 | -37.6 | -34.2 | -31.1 | -28.3 |
| EBITDA, % | 49.14 | -54.17 | -70 | -32.85 | 7.58 | -20.06 | -20.06 | -20.06 | -20.06 | -20.06 |
| Depreciation | 26.8 | 29.2 | 30.4 | 29.9 | 44.1 | 29.0 | 26.4 | 24.0 | 21.8 | 19.9 |
| Depreciation, % | 7.04 | 13.88 | 14.93 | 15.06 | 19.44 | 14.07 | 14.07 | 14.07 | 14.07 | 14.07 |
| EBIT | 160.2 | -143.4 | -173.2 | -95.0 | -26.9 | -70.4 | -64.0 | -58.2 | -52.9 | -48.1 |
| EBIT, % | 42.1 | -68.04 | -84.92 | -47.9 | -11.86 | -34.13 | -34.13 | -34.13 | -34.13 | -34.13 |
| Total Cash | 143.1 | 87.8 | 46.7 | 141.8 | 28.0 | 76.7 | 69.8 | 63.5 | 57.7 | 52.5 |
| Total Cash, percent | .0 | .0 | .0 | .0 | .0 | .0 | .0 | .0 | .0 | .0 |
| Account Receivables | 369.9 | 275.6 | 245.2 | 139.6 | 190.4 | 186.3 | 169.4 | 154.0 | 140.1 | 127.4 |
| Account Receivables, % | 97.22 | 130.75 | 120.22 | 70.37 | 83.93 | 90.3 | 90.3 | 90.3 | 90.3 | 90.3 |
| Inventories | 358.6 | 297.0 | 272.5 | 155.8 | 222.3 | 194.2 | 176.6 | 160.6 | 146.1 | 132.9 |
| Inventories, % | 94.27 | 140.94 | 133.63 | 78.55 | 98.01 | 94.16 | 94.16 | 94.16 | 94.16 | 94.16 |
| Accounts Payable | 172.2 | 107.8 | 103.9 | 95.8 | 128.7 | 104.1 | 94.7 | 86.1 | 78.3 | 71.2 |
| Accounts Payable, % | 45.27 | 51.16 | 50.95 | 48.28 | 56.75 | 50.48 | 50.48 | 50.48 | 50.48 | 50.48 |
| Capital Expenditure | -9.5 | -7.4 | -.9 | -1.1 | -2.5 | -3.3 | -3.0 | -2.8 | -2.5 | -2.3 |
| Capital Expenditure, % | -2.5 | -3.51 | -0.42799 | -0.54306 | -1.09 | -1.61 | -1.61 | -1.61 | -1.61 | -1.61 |
| Tax Rate, % | 0.40404 | 0.40404 | 0.40404 | 0.40404 | 0.40404 | 0.40404 | 0.40404 | 0.40404 | 0.40404 | 0.40404 |
| EBITAT | 154.3 | -156.3 | -211.1 | -94.7 | -26.8 | -69.8 | -63.5 | -57.7 | -52.5 | -47.7 |
| Depreciation | ||||||||||
| Changes in Account Receivables | ||||||||||
| Changes in Inventories | ||||||||||
| Changes in Accounts Payable | ||||||||||
| Capital Expenditure | ||||||||||
| UFCF | -384.7 | -42.9 | -130.6 | 148.3 | -69.5 | -36.5 | -15.1 | -13.7 | -12.5 | -11.3 |
| WACC, % | 8.5 | 8.51 | 8.51 | 8.51 | 8.51 | 8.5 | 8.5 | 8.5 | 8.5 | 8.5 |
| PV UFCF | ||||||||||
| SUM PV UFCF | -73.7 | |||||||||
| Long Term Growth Rate, % | 2.00 | |||||||||
| Free cash flow (T + 1) | -12 | |||||||||
| Terminal Value | -178 | |||||||||
| Present Terminal Value | -118 | |||||||||
| Enterprise Value | -192 | |||||||||
| Net Debt | 144 | |||||||||
| Equity Value | -336 | |||||||||
| Diluted Shares Outstanding, MM | 484 | |||||||||
| Equity Value Per Share | -0.69 |
What You'll Receive
- Authentic Anshan Senyuan Data: Comprehensive financials – covering everything from revenue to EBIT – derived from actual and projected statistics.
- Complete Customization: Modify all essential parameters (yellow cells) such as WACC, growth %, and tax rates.
- Immediate Valuation Adjustments: Automatic recalculations to assess the impact of changes on the fair value of Anshan Senyuan (300210SZ).
- Flexible Excel Template: Designed for quick modifications, scenario analysis, and in-depth projections.
- Efficient and Accurate: Avoid the hassle of building models from the ground up while preserving precision and adaptability.
Key Features
- Customizable Financial Inputs: Adjust essential parameters such as revenue growth, EBITDA %, and capital expenditures specific to Anshan Senyuan Road and Bridge Co., Ltd (300210SZ).
- Real-Time DCF Valuation: Instantly computes intrinsic value, NPV, and additional metrics for [Symbol].
- High-Precision Accuracy: Utilizes real financial data from Anshan Senyuan for meaningful valuation results.
- Simplified Scenario Testing: Easily explore various assumptions and analyze their impacts on outcomes.
- Efficient Valuation Tool: Streamlines the process by removing the need for complex valuation model construction.
How It Functions
- Download: Obtain the pre-configured Excel file containing Anshan Senyuan Road and Bridge Co., Ltd's (300210SZ) financial information.
- Customize: Tailor your forecasts by modifying metrics such as revenue growth, EBITDA margin, and WACC.
- Automatic Updates: Watch as intrinsic value and NPV calculations refresh in real-time.
- Scenario Testing: Develop various projections and evaluate different outcomes instantly.
- Make Informed Choices: Leverage the valuation insights to shape your investment strategy.
Why Choose This Calculator for Anshan Senyuan Road and Bridge Co., Ltd (300210SZ)?
- User-Friendly Interface: Perfect for both novices and seasoned professionals.
- Customizable Inputs: Easily adjust parameters to suit your specific analysis needs.
- Real-Time Feedback: Observe immediate updates to the valuation of Anshan Senyuan as you change inputs.
- Pre-Loaded with Data: Comes with the latest financial information for Anshan Senyuan for a swift assessment.
- Endorsed by Industry Experts: Utilized by investors and analysts for making strategic financial decisions.
Who Can Benefit from This Product?
- Engineering Students: Master bridge design principles and apply them with real-world projects.
- Researchers: Integrate advanced engineering models into your academic studies or publications.
- Contractors: Evaluate your own project assumptions and assess construction outcomes for Anshan Senyuan Road and Bridge Co., Ltd (300210SZ).
- Project Managers: Optimize your planning with a customizable project management tool tailored for infrastructure development.
- Small Business Owners: Understand how major infrastructure firms like Anshan Senyuan Road and Bridge Co., Ltd (300210SZ) approach project evaluations.
Contents of the Template
- Pre-Filled Data: Contains Anshan Senyuan Road and Bridge Co., Ltd's historical financials and projections.
- Discounted Cash Flow Model: An editable DCF valuation model featuring automatic calculations.
- Weighted Average Cost of Capital (WACC): A dedicated sheet for determining WACC using custom inputs.
- Key Financial Ratios: Evaluate Anshan Senyuan's profitability, efficiency, and leverage metrics.
- Customizable Inputs: Easily modify revenue growth, profit margins, and tax rates.
- Clear Dashboard: Visual representations through charts and tables summarizing essential valuation outcomes.
Disclaimer
All information, articles, and product details provided on this website are for general informational and educational purposes only. We do not claim any ownership over, nor do we intend to infringe upon, any trademarks, copyrights, logos, brand names, or other intellectual property mentioned or depicted on this site. Such intellectual property remains the property of its respective owners, and any references here are made solely for identification or informational purposes, without implying any affiliation, endorsement, or partnership.
We make no representations or warranties, express or implied, regarding the accuracy, completeness, or suitability of any content or products presented. Nothing on this website should be construed as legal, tax, investment, financial, medical, or other professional advice. In addition, no part of this site—including articles or product references—constitutes a solicitation, recommendation, endorsement, advertisement, or offer to buy or sell any securities, franchises, or other financial instruments, particularly in jurisdictions where such activity would be unlawful.
All content is of a general nature and may not address the specific circumstances of any individual or entity. It is not a substitute for professional advice or services. Any actions you take based on the information provided here are strictly at your own risk. You accept full responsibility for any decisions or outcomes arising from your use of this website and agree to release us from any liability in connection with your use of, or reliance upon, the content or products found herein.