
|
Yantai Zhenghai Magnetic Material Co., Ltd. (300224.sz) Valoración de DCF |
Completamente Editable: Adáptelo A Sus Necesidades En Excel O Sheets
Diseño Profesional: Plantillas Confiables Y Estándares De La Industria
Predeterminadas Para Un Uso Rápido Y Eficiente
Compatible con MAC / PC, completamente desbloqueado
No Se Necesita Experiencia; Fáciles De Seguir
Yantai Zhenghai Magnetic Material Co., Ltd. (300224.SZ) Bundle
¡Mejore sus estrategias de inversión con la calculadora DCF [símbolo]! Explore el auténtico Yantai Zhenghai Magnetic Material Co., Ltd. Financials, ajuste las proyecciones y gastos de crecimiento, y visualice instantáneamente cómo estos cambios afectan el valor intrínseco [símbolo].
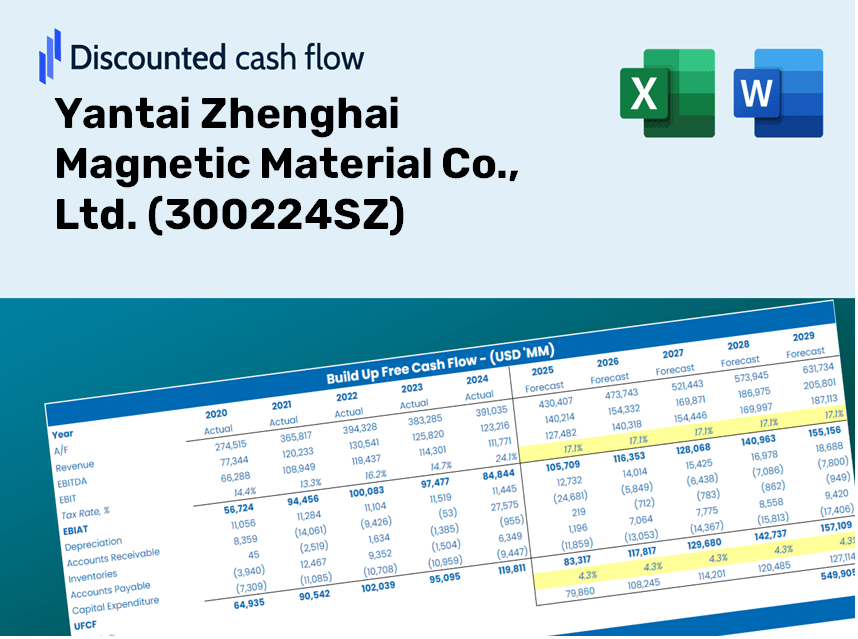
Discounted Cash Flow (DCF) - (USD MM)
| Year | AY1 2020 |
AY2 2021 |
AY3 2022 |
AY4 2023 |
AY5 2024 |
FY1 2025 |
FY2 2026 |
FY3 2027 |
FY4 2028 |
FY5 2029 |
|---|---|---|---|---|---|---|---|---|---|---|
| Revenue | 1,953.9 | 3,369.7 | 6,319.0 | 5,873.7 | 5,539.1 | 7,578.1 | 10,367.5 | 14,183.8 | 19,404.8 | 26,547.6 |
| Revenue Growth, % | 0 | 72.46 | 87.52 | -7.05 | -5.7 | 36.81 | 36.81 | 36.81 | 36.81 | 36.81 |
| EBITDA | 177.1 | 372.0 | 508.4 | 646.8 | 325.3 | 682.5 | 933.8 | 1,277.5 | 1,747.7 | 2,391.1 |
| EBITDA, % | 9.06 | 11.04 | 8.05 | 11.01 | 5.87 | 9.01 | 9.01 | 9.01 | 9.01 | 9.01 |
| Depreciation | 78.3 | 76.7 | 103.3 | 127.6 | 152.9 | 194.8 | 266.4 | 364.5 | 498.7 | 682.3 |
| Depreciation, % | 4.01 | 2.28 | 1.63 | 2.17 | 2.76 | 2.57 | 2.57 | 2.57 | 2.57 | 2.57 |
| EBIT | 98.8 | 295.2 | 405.1 | 519.2 | 172.4 | 487.8 | 667.3 | 913.0 | 1,249.0 | 1,708.8 |
| EBIT, % | 5.06 | 8.76 | 6.41 | 8.84 | 3.11 | 6.44 | 6.44 | 6.44 | 6.44 | 6.44 |
| Total Cash | 1,089.4 | 847.8 | 2,407.7 | 2,442.6 | 2,251.4 | 3,050.1 | 4,172.8 | 5,708.7 | 7,810.1 | 10,685.0 |
| Total Cash, percent | .0 | .0 | .0 | .0 | .0 | .0 | .0 | .0 | .0 | .0 |
| Account Receivables | 918.3 | 1,340.9 | 2,572.5 | 1,958.6 | 2,186.5 | 3,036.1 | 4,153.7 | 5,682.6 | 7,774.4 | 10,636.1 |
| Account Receivables, % | 47 | 39.79 | 40.71 | 33.34 | 39.47 | 40.06 | 40.06 | 40.06 | 40.06 | 40.06 |
| Inventories | 719.3 | 1,204.4 | 1,646.7 | 1,530.6 | 1,736.2 | 2,364.6 | 3,235.0 | 4,425.8 | 6,055.0 | 8,283.8 |
| Inventories, % | 36.81 | 35.74 | 26.06 | 26.06 | 31.34 | 31.2 | 31.2 | 31.2 | 31.2 | 31.2 |
| Accounts Payable | 1,052.6 | 1,798.3 | 3,492.1 | 2,892.3 | 769.3 | 3,419.7 | 4,678.5 | 6,400.7 | 8,756.7 | 11,980.1 |
| Accounts Payable, % | 53.87 | 53.37 | 55.26 | 49.24 | 13.89 | 45.13 | 45.13 | 45.13 | 45.13 | 45.13 |
| Capital Expenditure | -146.6 | -343.1 | -482.8 | -395.8 | -210.0 | -543.4 | -743.4 | -1,017.1 | -1,391.5 | -1,903.7 |
| Capital Expenditure, % | -7.5 | -10.18 | -7.64 | -6.74 | -3.79 | -7.17 | -7.17 | -7.17 | -7.17 | -7.17 |
| Tax Rate, % | 48.47 | 48.47 | 48.47 | 48.47 | 48.47 | 48.47 | 48.47 | 48.47 | 48.47 | 48.47 |
| EBITAT | 96.7 | 279.2 | 379.7 | 417.6 | 88.8 | 407.8 | 557.9 | 763.3 | 1,044.2 | 1,428.6 |
| Depreciation | ||||||||||
| Changes in Account Receivables | ||||||||||
| Changes in Inventories | ||||||||||
| Changes in Accounts Payable | ||||||||||
| Capital Expenditure | ||||||||||
| UFCF | -556.7 | -149.2 | 20.0 | 279.6 | -2,524.8 | 1,231.5 | -648.3 | -886.9 | -1,213.4 | -1,660.0 |
| WACC, % | 4.71 | 4.69 | 4.69 | 4.62 | 4.48 | 4.64 | 4.64 | 4.64 | 4.64 | 4.64 |
| PV UFCF | ||||||||||
| SUM PV UFCF | -2,524.6 | |||||||||
| Long Term Growth Rate, % | 3.50 | |||||||||
| Free cash flow (T + 1) | -1,718 | |||||||||
| Terminal Value | -150,862 | |||||||||
| Present Terminal Value | -120,259 | |||||||||
| Enterprise Value | -122,783 | |||||||||
| Net Debt | 22 | |||||||||
| Equity Value | -122,805 | |||||||||
| Diluted Shares Outstanding, MM | 839 | |||||||||
| Equity Value Per Share | -146.29 |
Benefits You Will Receive
- Genuine Yantai Zhenghai Data: Preloaded financials – from revenue to EBIT – leveraging both actual and projected figures.
- Comprehensive Customization: Modify all key parameters (yellow cells) such as WACC, growth %, and tax rates as needed.
- Real-Time Valuation Adjustments: Automatic recalculations that enable analysis of how changes affect the fair value of Yantai Zhenghai Magnetic Material Co., Ltd. (300224SZ).
- Flexible Excel Template: Designed for quick edits, scenario analysis, and detailed forecasting.
- Efficient and Precise: Avoid the hassle of creating models from scratch while ensuring accuracy and adaptability.
Key Features
- Comprehensive Historical Data: Yantai Zhenghai Magnetic Material Co., Ltd.'s financial statements and detailed forecasts.
- Customizable Parameters: Modify WACC, tax rates, revenue growth, and EBITDA margins to suit your analysis.
- Real-Time Valuation: Instantly view the recalculated intrinsic value for Yantai Zhenghai Magnetic Material Co., Ltd. ([300224SZ]).
- Detailed Visual Representations: Dashboard graphs illustrate valuation outcomes and essential financial metrics.
- Designed for Precision: A robust tool tailored for analysts, investors, and finance professionals.
How It Operates
- Download: Obtain the pre-configured Excel file containing Yantai Zhenghai Magnetic Material Co., Ltd.'s financial data.
- Customize: Modify projections such as revenue growth, EBITDA %, and WACC to suit your analysis.
- Real-Time Updates: The intrinsic value and NPV calculations refresh automatically as changes are made.
- Explore Scenarios: Generate various forecasts and compare their results in an instant.
- Make Informed Choices: Leverage the valuation insights to shape your investment approach.
Why Choose Our Calculator for Yantai Zhenghai Magnetic Material Co., Ltd. (300224SZ)?
- All-in-One Tool: Combines DCF, WACC, and financial ratio assessments in a single platform.
- Flexible Inputs: Modify the yellow-highlighted fields to explore different financial scenarios.
- In-Depth Analysis: Automatically computes Yantai Zhenghai's intrinsic value and Net Present Value.
- Integrated Data: Features historical and projected data for reliable starting points.
- Expert-Level Standard: Perfect for financial analysts, investors, and business consultants.
Who Can Benefit from This Product?
- Students of Material Science: Master the properties and applications of magnetic materials using real-world examples.
- Researchers: Integrate advanced magnetic material models into your studies and publications.
- Investors: Validate your investment strategies by analyzing the performance metrics of Yantai Zhenghai Magnetic Material Co., Ltd. (300224SZ).
- Industry Analysts: Enhance your analysis with a customizable framework for evaluating magnetic material companies.
- Entrepreneurs: Understand the market dynamics and evaluation techniques used for leading companies like Yantai Zhenghai Magnetic Material Co., Ltd. (300224SZ).
Contents of the Template
- Operating and Balance Sheet Data: Pre-filled historical data and forecasts for Yantai Zhenghai Magnetic Material Co., Ltd. (300224SZ), including revenue, EBITDA, EBIT, and capital expenditures.
- WACC Calculation: A dedicated sheet for calculating the Weighted Average Cost of Capital (WACC), featuring parameters such as Beta, risk-free rate, and share price.
- DCF Valuation (Unlevered and Levered): Customizable Discounted Cash Flow models that illustrate intrinsic value, complete with detailed calculations.
- Financial Statements: Pre-loaded financial statements (annual and quarterly) to facilitate in-depth analysis.
- Key Ratios: A collection of profitability, leverage, and efficiency ratios specific to Yantai Zhenghai Magnetic Material Co., Ltd. (300224SZ).
- Dashboard and Charts: A visual overview of valuation outputs and assumptions, designed for easy analysis of results.
Disclaimer
All information, articles, and product details provided on this website are for general informational and educational purposes only. We do not claim any ownership over, nor do we intend to infringe upon, any trademarks, copyrights, logos, brand names, or other intellectual property mentioned or depicted on this site. Such intellectual property remains the property of its respective owners, and any references here are made solely for identification or informational purposes, without implying any affiliation, endorsement, or partnership.
We make no representations or warranties, express or implied, regarding the accuracy, completeness, or suitability of any content or products presented. Nothing on this website should be construed as legal, tax, investment, financial, medical, or other professional advice. In addition, no part of this site—including articles or product references—constitutes a solicitation, recommendation, endorsement, advertisement, or offer to buy or sell any securities, franchises, or other financial instruments, particularly in jurisdictions where such activity would be unlawful.
All content is of a general nature and may not address the specific circumstances of any individual or entity. It is not a substitute for professional advice or services. Any actions you take based on the information provided here are strictly at your own risk. You accept full responsibility for any decisions or outcomes arising from your use of this website and agree to release us from any liability in connection with your use of, or reliance upon, the content or products found herein.