
|
Dian Diagnostics Group Co., Ltd. (300244.sz) valoración de DCF |
Completamente Editable: Adáptelo A Sus Necesidades En Excel O Sheets
Diseño Profesional: Plantillas Confiables Y Estándares De La Industria
Predeterminadas Para Un Uso Rápido Y Eficiente
Compatible con MAC / PC, completamente desbloqueado
No Se Necesita Experiencia; Fáciles De Seguir
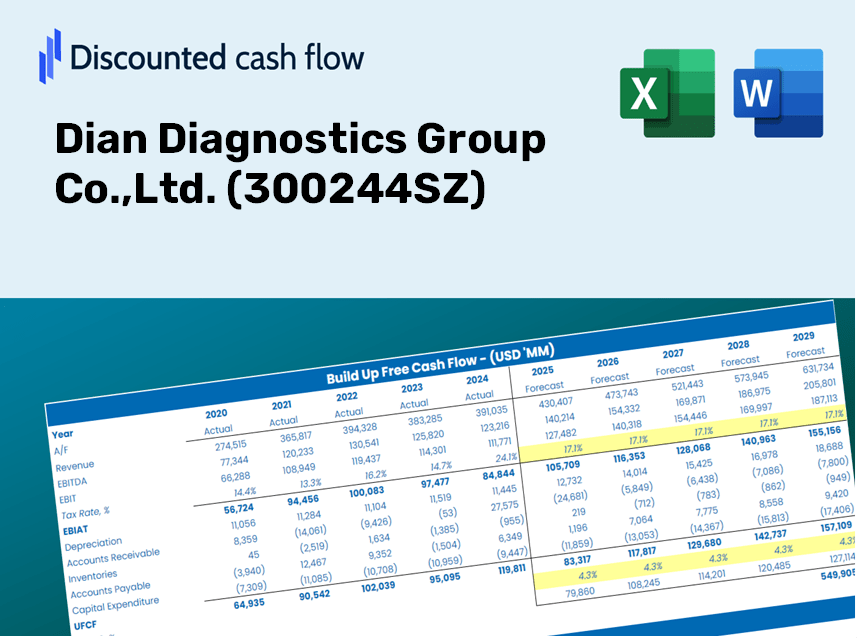
Dian Diagnostics Group Co.,Ltd. (300244.SZ) Bundle
¡Obtenga información sobre su Dian Diagnostics Group Co., Ltd. (300244SZ) Análisis de valoración con nuestra calculadora DCF de vanguardia! Esta plantilla de Excel viene precargada con datos reales (300244SZ), lo que le permite ajustar los pronósticos y los supuestos para calcular con precisión el valor intrínseco de Dian Diagnostics Group Co., Ltd.
Discounted Cash Flow (DCF) - (USD MM)
| Year | AY1 2020 |
AY2 2021 |
AY3 2022 |
AY4 2023 |
AY5 2024 |
FY1 2025 |
FY2 2026 |
FY3 2027 |
FY4 2028 |
FY5 2029 |
|---|---|---|---|---|---|---|---|---|---|---|
| Revenue | 10,649.2 | 13,082.6 | 20,282.5 | 13,408.3 | 12,196.2 | 12,653.2 | 13,127.2 | 13,619.0 | 14,129.2 | 14,658.6 |
| Revenue Growth, % | 0 | 22.85 | 55.03 | -33.89 | -9.04 | 3.75 | 3.75 | 3.75 | 3.75 | 3.75 |
| EBITDA | 2,195.3 | 2,468.5 | 4,246.9 | 1,466.6 | 928.3 | 1,998.5 | 2,073.3 | 2,151.0 | 2,231.6 | 2,315.2 |
| EBITDA, % | 20.61 | 18.87 | 20.94 | 10.94 | 7.61 | 15.79 | 15.79 | 15.79 | 15.79 | 15.79 |
| Depreciation | 292.9 | 341.6 | 590.2 | 453.5 | 381.9 | 374.2 | 388.2 | 402.7 | 417.8 | 433.5 |
| Depreciation, % | 2.75 | 2.61 | 2.91 | 3.38 | 3.13 | 2.96 | 2.96 | 2.96 | 2.96 | 2.96 |
| EBIT | 1,902.4 | 2,126.9 | 3,656.7 | 1,013.1 | 546.3 | 1,624.3 | 1,685.2 | 1,748.3 | 1,813.8 | 1,881.8 |
| EBIT, % | 17.86 | 16.26 | 18.03 | 7.56 | 4.48 | 12.84 | 12.84 | 12.84 | 12.84 | 12.84 |
| Total Cash | 2,053.3 | 2,615.9 | 4,650.1 | 3,391.6 | 2,214.9 | 2,673.8 | 2,774.0 | 2,877.9 | 2,985.8 | 3,097.6 |
| Total Cash, percent | .0 | .0 | .0 | .0 | .0 | .0 | .0 | .0 | .0 | .0 |
| Account Receivables | 4,635.5 | 6,561.4 | 10,143.3 | 8,500.4 | 7,522.0 | 6,801.4 | 7,056.3 | 7,320.6 | 7,594.9 | 7,879.4 |
| Account Receivables, % | 43.53 | 50.15 | 50.01 | 63.4 | 61.67 | 53.75 | 53.75 | 53.75 | 53.75 | 53.75 |
| Inventories | 1,122.6 | 1,331.6 | 1,434.3 | 1,508.9 | 1,634.8 | 1,327.3 | 1,377.0 | 1,428.6 | 1,482.2 | 1,537.7 |
| Inventories, % | 10.54 | 10.18 | 7.07 | 11.25 | 13.4 | 10.49 | 10.49 | 10.49 | 10.49 | 10.49 |
| Accounts Payable | 1,528.1 | 2,173.5 | 3,126.4 | 1,938.9 | 1,764.0 | 1,905.6 | 1,977.0 | 2,051.0 | 2,127.9 | 2,207.6 |
| Accounts Payable, % | 14.35 | 16.61 | 15.41 | 14.46 | 14.46 | 15.06 | 15.06 | 15.06 | 15.06 | 15.06 |
| Capital Expenditure | -475.7 | -589.5 | -947.7 | -701.8 | -363.2 | -553.1 | -573.9 | -595.4 | -617.7 | -640.8 |
| Capital Expenditure, % | -4.47 | -4.51 | -4.67 | -5.23 | -2.98 | -4.37 | -4.37 | -4.37 | -4.37 | -4.37 |
| Tax Rate, % | -589.38 | -589.38 | -589.38 | -589.38 | -589.38 | -589.38 | -589.38 | -589.38 | -589.38 | -589.38 |
| EBITAT | 1,159.5 | 1,381.0 | 2,061.8 | 390.2 | 3,766.4 | 1,042.1 | 1,081.1 | 1,121.6 | 1,163.7 | 1,207.2 |
| Depreciation | ||||||||||
| Changes in Account Receivables | ||||||||||
| Changes in Inventories | ||||||||||
| Changes in Accounts Payable | ||||||||||
| Capital Expenditure | ||||||||||
| UFCF | -3,253.4 | -356.4 | -1,027.3 | 522.6 | 4,462.7 | 2,032.8 | 662.3 | 687.1 | 712.9 | 739.6 |
| WACC, % | 5.45 | 5.53 | 5.37 | 5.02 | 6.2 | 5.51 | 5.51 | 5.51 | 5.51 | 5.51 |
| PV UFCF | ||||||||||
| SUM PV UFCF | 4,247.0 | |||||||||
| Long Term Growth Rate, % | 2.00 | |||||||||
| Free cash flow (T + 1) | 754 | |||||||||
| Terminal Value | 21,467 | |||||||||
| Present Terminal Value | 16,414 | |||||||||
| Enterprise Value | 20,661 | |||||||||
| Net Debt | 571 | |||||||||
| Equity Value | 20,090 | |||||||||
| Diluted Shares Outstanding, MM | 613 | |||||||||
| Equity Value Per Share | 32.80 |
Benefits You Will Receive
- Pre-Filled Financial Model: Utilize Dian Diagnostics Group Co., Ltd.'s actual data for precise DCF valuation.
- Comprehensive Forecast Control: Modify revenue growth, operating margins, WACC, and other essential factors.
- Real-Time Calculations: Automatic updates provide immediate results as you adjust inputs.
- Investor-Ready Template: A polished Excel spreadsheet crafted for professional-quality valuation.
- Customizable and Reusable: Designed for flexibility, enabling extensive use for in-depth forecasts.
Key Features
- Accurate Dian Diagnostics Financials: Gain access to reliable pre-loaded historical data and future forecasts.
- Customizable Projection Parameters: Modify highlighted cells for key metrics like WACC, growth rates, and profit margins.
- Instantaneous Calculations: Automatic updates for DCF, Net Present Value (NPV), and cash flow analysis.
- Interactive Dashboard: User-friendly charts and summaries to help visualize your valuation outcomes.
- Designed for All Experience Levels: A straightforward and intuitive layout tailored for investors, CFOs, and consultants.
How It Works
- Step 1: Download the Excel file.
- Step 2: Examine the pre-filled data for Dian Diagnostics Group Co., Ltd. (300244SZ), including historical and projected figures.
- Step 3: Modify key assumptions (highlighted in yellow) based on your analysis.
- Step 4: Observe the automatic updates to Dian Diagnostics' intrinsic value.
- Step 5: Utilize the results to inform your investment decisions or for reporting purposes.
Why Opt for Dian Diagnostics Group's Calculator?
- Reliable Data: Authentic financial information from Dian Diagnostics guarantees trustworthy valuation outcomes.
- Tailorable: Modify critical variables such as growth rates, WACC, and tax rates to align with your forecasts.
- Efficiency Boost: Ready-made calculations save you from starting over.
- Professional-Quality Tool: Specifically crafted for investors, analysts, and consultants working with Dian Diagnostics [300244SZ].
- Easy to Use: A straightforward design and clear step-by-step guidance cater to all users.
Who Can Benefit from Our Services?
- Healthcare Professionals: Enhance your diagnostic skills and apply advanced techniques using real-case data.
- Researchers: Integrate innovative models into your studies or clinical trials.
- Investors: Evaluate your investment strategies and analyze valuation trends for Dian Diagnostics Group Co.,Ltd. (300244SZ).
- Data Analysts: Optimize your processes with our pre-built, adaptable diagnostic models.
- Medical Entrepreneurs: Discover how established firms like Dian Diagnostics Group Co.,Ltd. (300244SZ) approach market analysis.
Contents of the Template
- Pre-Filled DCF Model: Dian Diagnostics Group Co., Ltd.'s financial data ready for immediate analysis.
- WACC Calculator: Comprehensive calculations for the Weighted Average Cost of Capital.
- Financial Ratios: Assess Dian Diagnostics' profitability, leverage, and operational efficiency.
- Editable Inputs: Modify key assumptions such as growth rates, profit margins, and CAPEX to suit your analysis.
- Financial Statements: Access annual and quarterly financial reports for thorough evaluation.
- Interactive Dashboard: Effortlessly visualize essential valuation metrics and outcomes.
Disclaimer
All information, articles, and product details provided on this website are for general informational and educational purposes only. We do not claim any ownership over, nor do we intend to infringe upon, any trademarks, copyrights, logos, brand names, or other intellectual property mentioned or depicted on this site. Such intellectual property remains the property of its respective owners, and any references here are made solely for identification or informational purposes, without implying any affiliation, endorsement, or partnership.
We make no representations or warranties, express or implied, regarding the accuracy, completeness, or suitability of any content or products presented. Nothing on this website should be construed as legal, tax, investment, financial, medical, or other professional advice. In addition, no part of this site—including articles or product references—constitutes a solicitation, recommendation, endorsement, advertisement, or offer to buy or sell any securities, franchises, or other financial instruments, particularly in jurisdictions where such activity would be unlawful.
All content is of a general nature and may not address the specific circumstances of any individual or entity. It is not a substitute for professional advice or services. Any actions you take based on the information provided here are strictly at your own risk. You accept full responsibility for any decisions or outcomes arising from your use of this website and agree to release us from any liability in connection with your use of, or reliance upon, the content or products found herein.