
|
Hebei Changshan Biochemical Pharmaceutical Co., Ltd. (300255.SZ) DCF Valoración |
Completamente Editable: Adáptelo A Sus Necesidades En Excel O Sheets
Diseño Profesional: Plantillas Confiables Y Estándares De La Industria
Predeterminadas Para Un Uso Rápido Y Eficiente
Compatible con MAC / PC, completamente desbloqueado
No Se Necesita Experiencia; Fáciles De Seguir
Hebei Changshan Biochemical Pharmaceutical Co., Ltd. (300255.SZ) Bundle
Diseñada para la precisión, nuestra calculadora DCF (300255SZ) le permite evaluar Hebei Changshan Biochemical Pharmaceutical Co., Ltd. Valoración utilizando datos financieros del mundo real, ofreciendo una flexibilidad completa para modificar todos los parámetros esenciales para mejoras mejoradas.
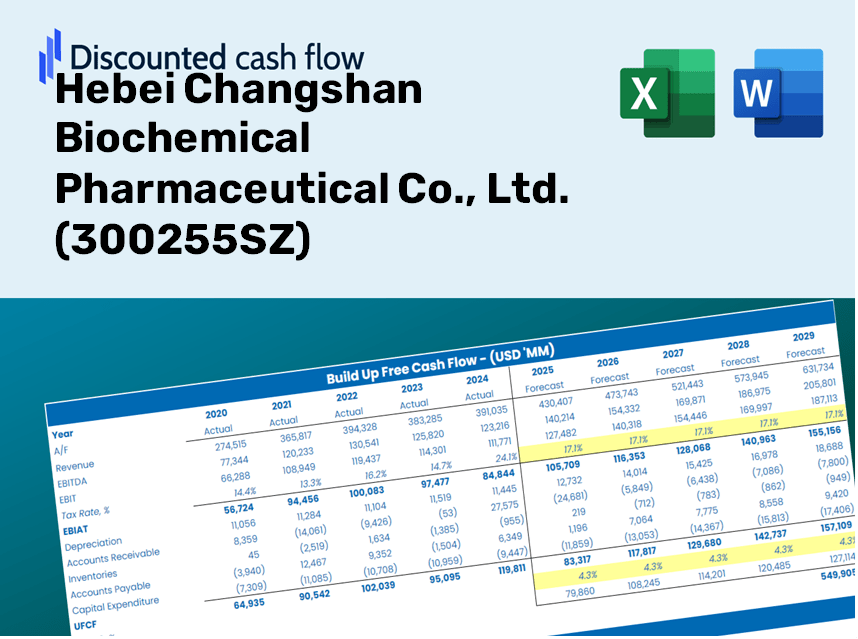
Discounted Cash Flow (DCF) - (USD MM)
| Year | AY1 2020 |
AY2 2021 |
AY3 2022 |
AY4 2023 |
AY5 2024 |
FY1 2025 |
FY2 2026 |
FY3 2027 |
FY4 2028 |
FY5 2029 |
|---|---|---|---|---|---|---|---|---|---|---|
| Revenue | 2,363.8 | 2,968.1 | 2,336.2 | 1,410.4 | 1,030.8 | 1,156.6 | 1,297.7 | 1,456.1 | 1,633.7 | 1,833.1 |
| Revenue Growth, % | 0 | 25.56 | -21.29 | -39.63 | -26.92 | 12.2 | 12.2 | 12.2 | 12.2 | 12.2 |
| EBITDA | 424.1 | 379.9 | 164.9 | -1,070.5 | -106.8 | -112.1 | -125.8 | -141.1 | -158.4 | -177.7 |
| EBITDA, % | 17.94 | 12.8 | 7.06 | -75.9 | -10.36 | -9.69 | -9.69 | -9.69 | -9.69 | -9.69 |
| Depreciation | 55.3 | 55.8 | 56.9 | 74.4 | 72.0 | 43.7 | 49.1 | 55.1 | 61.8 | 69.3 |
| Depreciation, % | 2.34 | 1.88 | 2.44 | 5.27 | 6.98 | 3.78 | 3.78 | 3.78 | 3.78 | 3.78 |
| EBIT | 368.8 | 324.1 | 108.0 | -1,144.9 | -178.8 | -155.9 | -174.9 | -196.2 | -220.2 | -247.0 |
| EBIT, % | 15.6 | 10.92 | 4.62 | -81.18 | -17.34 | -13.48 | -13.48 | -13.48 | -13.48 | -13.48 |
| Total Cash | 481.0 | 543.2 | 797.8 | 230.9 | 236.4 | 259.3 | 291.0 | 326.5 | 366.3 | 411.0 |
| Total Cash, percent | .0 | .0 | .0 | .0 | .0 | .0 | .0 | .0 | .0 | .0 |
| Account Receivables | 427.2 | 317.1 | 481.7 | 264.9 | 277.2 | 219.9 | 246.7 | 276.8 | 310.6 | 348.5 |
| Account Receivables, % | 18.07 | 10.68 | 20.62 | 18.78 | 26.89 | 19.01 | 19.01 | 19.01 | 19.01 | 19.01 |
| Inventories | 1,887.0 | 2,285.0 | 2,431.5 | 1,644.3 | 1,385.7 | 1,056.7 | 1,185.6 | 1,330.3 | 1,492.6 | 1,674.8 |
| Inventories, % | 79.83 | 76.99 | 104.08 | 116.58 | 134.43 | 91.36 | 91.36 | 91.36 | 91.36 | 91.36 |
| Accounts Payable | 82.4 | 106.5 | 249.8 | 165.9 | 307.5 | 137.3 | 154.0 | 172.8 | 193.9 | 217.6 |
| Accounts Payable, % | 3.48 | 3.59 | 10.69 | 11.76 | 29.83 | 11.87 | 11.87 | 11.87 | 11.87 | 11.87 |
| Capital Expenditure | -199.8 | -308.1 | -431.2 | -239.3 | -239.6 | -179.3 | -201.1 | -225.7 | -253.2 | -284.1 |
| Capital Expenditure, % | -8.45 | -10.38 | -18.46 | -16.97 | -23.24 | -15.5 | -15.5 | -15.5 | -15.5 | -15.5 |
| Tax Rate, % | 2.96 | 2.96 | 2.96 | 2.96 | 2.96 | 2.96 | 2.96 | 2.96 | 2.96 | 2.96 |
| EBITAT | 309.2 | 290.7 | 104.4 | -1,152.8 | -173.5 | -145.6 | -163.4 | -183.4 | -205.7 | -230.8 |
| Depreciation | ||||||||||
| Changes in Account Receivables | ||||||||||
| Changes in Inventories | ||||||||||
| Changes in Accounts Payable | ||||||||||
| Capital Expenditure | ||||||||||
| UFCF | -2,067.1 | -225.4 | -437.7 | -397.7 | 46.7 | -65.0 | -454.5 | -510.0 | -572.2 | -642.0 |
| WACC, % | 4.57 | 4.59 | 4.6 | 4.61 | 4.6 | 4.59 | 4.59 | 4.59 | 4.59 | 4.59 |
| PV UFCF | ||||||||||
| SUM PV UFCF | -1,914.2 | |||||||||
| Long Term Growth Rate, % | 4.00 | |||||||||
| Free cash flow (T + 1) | -668 | |||||||||
| Terminal Value | -112,373 | |||||||||
| Present Terminal Value | -89,768 | |||||||||
| Enterprise Value | -91,682 | |||||||||
| Net Debt | 1,314 | |||||||||
| Equity Value | -92,997 | |||||||||
| Diluted Shares Outstanding, MM | 924 | |||||||||
| Equity Value Per Share | -100.65 |
What You Will Receive
- Authentic 300255 Financial Data: Pre-loaded with Hebei Changshan Biochemical Pharmaceutical Co., Ltd.'s historical and forecasted information for accurate analysis.
- Completely Customizable Template: Easily adjust essential inputs such as revenue growth, WACC, and EBITDA %.
- Instant Calculations: Observe real-time updates to Hebei Changshan's intrinsic value as you make modifications.
- Expert Valuation Tool: Tailored for investors, analysts, and consultants aiming for precise DCF results.
- Intuitive Design: Organized layout and straightforward instructions suitable for all skill levels.
Key Features
- Comprehensive Data Repository: Historical financial records and pre-filled projections for Hebei Changshan Biochemical Pharmaceutical Co., Ltd. (300255SZ).
- Customizable Parameters: Modify WACC, tax rates, revenue growth, and EBITDA margins with ease.
- Real-Time Valuation: Instantly view the recalculated intrinsic value of Hebei Changshan Biochemical Pharmaceutical Co., Ltd. (300255SZ).
- User-Friendly Charts: Visual dashboards present valuation results and essential metrics clearly.
- Designed for Precision: A reliable tool tailored for analysts, investors, and finance professionals.
How It Operates
- Step 1: Download the Excel spreadsheet.
- Step 2: Examine the pre-filled financial information and forecasts for Hebei Changshan Biochemical Pharmaceutical Co., Ltd. (300255SZ).
- Step 3: Adjust key parameters such as revenue growth, WACC, and tax rates (highlighted cells).
- Step 4: Observe the DCF model update in real-time as you modify your assumptions.
- Step 5: Assess the results and leverage the outputs for informed investment decisions.
Why Opt for Hebei Changshan Biochemical Pharmaceutical Co., Ltd. (300255SZ)?
- Reliability: Based on authentic Hebei Changshan financial data for dependable results.
- Adaptability: Tailored for users to easily experiment with and adjust parameters.
- Efficiency: Avoid the complexities of creating a financial model from the ground up.
- Expert-Level: Crafted with the precision and usability expected by financial professionals.
- Accessible: Simple interface, suitable for individuals without extensive financial modeling knowledge.
Who Should Use This Product?
- Pharmaceutical Students: Discover drug development processes and apply them to real-world case studies.
- Researchers: Integrate industry-standard models into your academic projects or scientific papers.
- Investors: Evaluate your investment strategies and assess the market performance of Hebei Changshan Biochemical Pharmaceutical Co., Ltd. (300255SZ).
- Market Analysts: Enhance your analysis with a customizable DCF model tailored for biopharmaceutical enterprises.
- Entrepreneurs: Understand how major pharmaceutical companies like Hebei Changshan Biochemical are evaluated in the market.
Contents of the Template
- Operating and Balance Sheet Data: Pre-filled historical data and forecasts for Hebei Changshan Biochemical Pharmaceutical Co., Ltd. (300255SZ), including revenue, EBITDA, EBIT, and capital expenditures.
- WACC Calculation: A dedicated sheet for calculating the Weighted Average Cost of Capital (WACC), featuring parameters such as Beta, risk-free rate, and share price.
- DCF Valuation (Unlevered and Levered): Customizable Discounted Cash Flow models that present intrinsic value along with detailed calculations.
- Financial Statements: Pre-loaded annual and quarterly financial statements to facilitate analysis.
- Key Ratios: A collection of profitability, leverage, and efficiency ratios specific to Hebei Changshan Biochemical Pharmaceutical Co., Ltd. (300255SZ).
- Dashboard and Charts: Visual representation of valuation outputs and assumptions to simplify result analysis.
Disclaimer
All information, articles, and product details provided on this website are for general informational and educational purposes only. We do not claim any ownership over, nor do we intend to infringe upon, any trademarks, copyrights, logos, brand names, or other intellectual property mentioned or depicted on this site. Such intellectual property remains the property of its respective owners, and any references here are made solely for identification or informational purposes, without implying any affiliation, endorsement, or partnership.
We make no representations or warranties, express or implied, regarding the accuracy, completeness, or suitability of any content or products presented. Nothing on this website should be construed as legal, tax, investment, financial, medical, or other professional advice. In addition, no part of this site—including articles or product references—constitutes a solicitation, recommendation, endorsement, advertisement, or offer to buy or sell any securities, franchises, or other financial instruments, particularly in jurisdictions where such activity would be unlawful.
All content is of a general nature and may not address the specific circumstances of any individual or entity. It is not a substitute for professional advice or services. Any actions you take based on the information provided here are strictly at your own risk. You accept full responsibility for any decisions or outcomes arising from your use of this website and agree to release us from any liability in connection with your use of, or reliance upon, the content or products found herein.