
|
Kaishan Group Co., Ltd. (300257.SZ) Valoración de DCF |
Completamente Editable: Adáptelo A Sus Necesidades En Excel O Sheets
Diseño Profesional: Plantillas Confiables Y Estándares De La Industria
Predeterminadas Para Un Uso Rápido Y Eficiente
Compatible con MAC / PC, completamente desbloqueado
No Se Necesita Experiencia; Fáciles De Seguir
Kaishan Group Co., Ltd. (300257.SZ) Bundle
¿Busca determinar el valor intrínseco de Kaishan Group Co., Ltd.? Nuestra calculadora DCF (300257SZ) fusiona datos prácticos con extensas funciones de personalización, lo que le permite ajustar preventos y mejorar sus opciones de inversión.
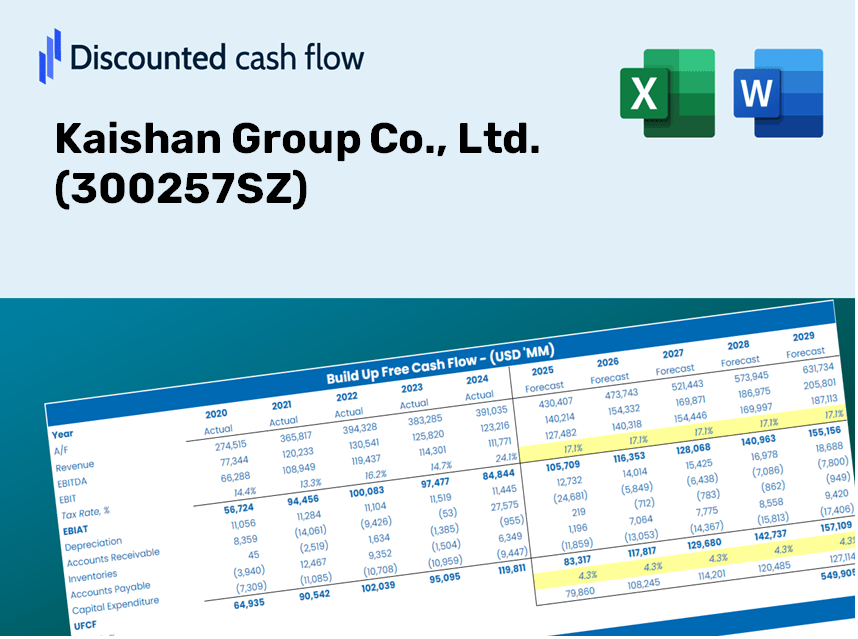
Discounted Cash Flow (DCF) - (USD MM)
| Year | AY1 2020 |
AY2 2021 |
AY3 2022 |
AY4 2023 |
AY5 2024 |
FY1 2025 |
FY2 2026 |
FY3 2027 |
FY4 2028 |
FY5 2029 |
|---|---|---|---|---|---|---|---|---|---|---|
| Revenue | 3,032.5 | 3,484.7 | 3,754.3 | 4,166.6 | 4,235.0 | 4,608.4 | 5,014.8 | 5,457.0 | 5,938.2 | 6,461.9 |
| Revenue Growth, % | 0 | 14.91 | 7.73 | 10.98 | 1.64 | 8.82 | 8.82 | 8.82 | 8.82 | 8.82 |
| EBITDA | 572.0 | 626.5 | 815.0 | 976.5 | 987.9 | 970.7 | 1,056.2 | 1,149.4 | 1,250.7 | 1,361.0 |
| EBITDA, % | 18.86 | 17.98 | 21.71 | 23.44 | 23.33 | 21.06 | 21.06 | 21.06 | 21.06 | 21.06 |
| Depreciation | 180.1 | 192.9 | 255.2 | 343.5 | 404.0 | 332.3 | 361.6 | 393.5 | 428.2 | 466.0 |
| Depreciation, % | 5.94 | 5.54 | 6.8 | 8.24 | 9.54 | 7.21 | 7.21 | 7.21 | 7.21 | 7.21 |
| EBIT | 391.9 | 433.6 | 559.8 | 633.0 | 583.9 | 638.3 | 694.6 | 755.9 | 822.5 | 895.1 |
| EBIT, % | 12.92 | 12.44 | 14.91 | 15.19 | 13.79 | 13.85 | 13.85 | 13.85 | 13.85 | 13.85 |
| Total Cash | 1,718.7 | 977.3 | 683.9 | 629.1 | 3,224.2 | 1,789.6 | 1,947.4 | 2,119.2 | 2,306.0 | 2,509.4 |
| Total Cash, percent | .0 | .0 | .0 | .0 | .0 | .0 | .0 | .0 | .0 | .0 |
| Account Receivables | 1,096.1 | 1,110.1 | 1,207.2 | 1,474.9 | 1,268.6 | 1,525.5 | 1,660.0 | 1,806.4 | 1,965.7 | 2,139.0 |
| Account Receivables, % | 36.15 | 31.86 | 32.15 | 35.4 | 29.96 | 33.1 | 33.1 | 33.1 | 33.1 | 33.1 |
| Inventories | 1,176.0 | 1,271.6 | 1,485.8 | 1,342.8 | 1,455.6 | 1,672.4 | 1,819.8 | 1,980.3 | 2,154.9 | 2,345.0 |
| Inventories, % | 38.78 | 36.49 | 39.58 | 32.23 | 34.37 | 36.29 | 36.29 | 36.29 | 36.29 | 36.29 |
| Accounts Payable | 1,894.9 | 1,831.1 | 1,637.0 | 1,226.0 | 844.0 | 1,917.0 | 2,086.1 | 2,270.0 | 2,470.2 | 2,688.0 |
| Accounts Payable, % | 62.49 | 52.55 | 43.6 | 29.43 | 19.93 | 41.6 | 41.6 | 41.6 | 41.6 | 41.6 |
| Capital Expenditure | -675.6 | -1,379.3 | -1,212.8 | -931.1 | -666.4 | -1,218.9 | -1,326.4 | -1,443.4 | -1,570.7 | -1,709.2 |
| Capital Expenditure, % | -22.28 | -39.58 | -32.31 | -22.35 | -15.74 | -26.45 | -26.45 | -26.45 | -26.45 | -26.45 |
| Tax Rate, % | 13.42 | 13.42 | 13.42 | 13.42 | 13.42 | 13.42 | 13.42 | 13.42 | 13.42 | 13.42 |
| EBITAT | 331.4 | 368.5 | 504.2 | 574.6 | 505.5 | 557.9 | 607.1 | 660.6 | 718.8 | 782.2 |
| Depreciation | ||||||||||
| Changes in Account Receivables | ||||||||||
| Changes in Inventories | ||||||||||
| Changes in Accounts Payable | ||||||||||
| Capital Expenditure | ||||||||||
| UFCF | -541.3 | -991.3 | -958.9 | -548.7 | -45.5 | 270.6 | -470.7 | -512.2 | -557.3 | -606.5 |
| WACC, % | 5.14 | 5.15 | 5.22 | 5.23 | 5.17 | 5.18 | 5.18 | 5.18 | 5.18 | 5.18 |
| PV UFCF | ||||||||||
| SUM PV UFCF | -1,534.7 | |||||||||
| Long Term Growth Rate, % | 4.00 | |||||||||
| Free cash flow (T + 1) | -631 | |||||||||
| Terminal Value | -53,306 | |||||||||
| Present Terminal Value | -41,404 | |||||||||
| Enterprise Value | -42,939 | |||||||||
| Net Debt | 3,867 | |||||||||
| Equity Value | -46,806 | |||||||||
| Diluted Shares Outstanding, MM | 1,001 | |||||||||
| Equity Value Per Share | -46.74 |
Benefits You'll Receive
- Flexible Forecast Inputs: Modify key assumptions (growth %, margins, WACC) to explore various scenarios.
- Industry-Specific Data: Kaishan Group Co., Ltd.'s financial data pre-filled to facilitate your analysis.
- Instant DCF Calculations: The template automatically computes Net Present Value (NPV) and intrinsic value for you.
- Professional and Adaptable: A sleek Excel model designed to suit your valuation requirements.
- Designed for Analysts and Investors: Perfect for evaluating projections, confirming strategies, and enhancing efficiency.
Key Features
- Comprehensive DCF Calculator: Features detailed unlevered and levered DCF valuation frameworks tailored for Kaishan Group Co., Ltd. (300257SZ).
- WACC Estimator: Pre-configured Weighted Average Cost of Capital model with adjustable parameters.
- Customizable Forecast Parameters: Alter growth estimates, capital expenditures, and discount rates as needed.
- Integrated Financial Ratios: Assess profitability, leverage, and efficiency ratios specific to Kaishan Group Co., Ltd. (300257SZ).
- Interactive Dashboard and Visualizations: Graphical representations that summarize essential valuation metrics for straightforward analysis.
How It Functions
- Download the Template: Gain immediate access to the Excel-based KGN DCF Calculator for Kaishan Group Co., Ltd. (300257SZ).
- Input Your Assumptions: Modify the yellow-highlighted cells to input growth rates, WACC, margins, and other relevant factors.
- Instant Calculations: The model will automatically refresh to display Kaishan's intrinsic value.
- Test Scenarios: Experiment with various assumptions to assess changes in valuation outcomes.
- Analyze and Decide: Utilize the results to inform your investment strategies or financial evaluations.
Why Choose the Kaishan Calculator?
- Designed for Experts: A sophisticated tool utilized by financial analysts, CFOs, and industry consultants.
- Comprehensive Data: Kaishan Group's historical and projected financials are preloaded for optimal accuracy.
- Scenario Analysis: Effortlessly simulate various forecasts and assumptions.
- Concise Outputs: Automatically computes intrinsic value, NPV, and essential metrics.
- User-Friendly: Step-by-step guidance makes navigation seamless.
Who Can Benefit from This Product?
- Institutional Investors: Create comprehensive and trustworthy valuation models to assess portfolios involving Kaishan Group Co., Ltd. (300257SZ).
- Corporate Finance Departments: Evaluate valuation scenarios to inform strategic decision-making within the organization.
- Financial Consultants and Advisors: Deliver precise valuation insights related to Kaishan Group Co., Ltd. (300257SZ) for their clients.
- Academics and Students: Leverage real-time data to enhance understanding and instruction in financial modeling.
- Industry Analysts: Gain insights into how companies like Kaishan Group Co., Ltd. (300257SZ) are valued within the tech sector.
What the Template Contains for Kaishan Group Co., Ltd. (300257SZ)
- Historical Data: Comprehensive insights into Kaishan's previous financial performance and foundational forecasts.
- DCF and Levered DCF Models: In-depth templates designed to assess the intrinsic value of Kaishan Group.
- WACC Sheet: Ready-made calculations for the Weighted Average Cost of Capital tailored to Kaishan Group.
- Editable Inputs: Customize essential variables such as growth rates, EBITDA percentages, and CAPEX projections.
- Quarterly and Annual Statements: An exhaustive analysis of Kaishan's financial statements.
- Interactive Dashboard: A dynamic platform to visualize valuation outcomes and forecasts effectively.
Disclaimer
All information, articles, and product details provided on this website are for general informational and educational purposes only. We do not claim any ownership over, nor do we intend to infringe upon, any trademarks, copyrights, logos, brand names, or other intellectual property mentioned or depicted on this site. Such intellectual property remains the property of its respective owners, and any references here are made solely for identification or informational purposes, without implying any affiliation, endorsement, or partnership.
We make no representations or warranties, express or implied, regarding the accuracy, completeness, or suitability of any content or products presented. Nothing on this website should be construed as legal, tax, investment, financial, medical, or other professional advice. In addition, no part of this site—including articles or product references—constitutes a solicitation, recommendation, endorsement, advertisement, or offer to buy or sell any securities, franchises, or other financial instruments, particularly in jurisdictions where such activity would be unlawful.
All content is of a general nature and may not address the specific circumstances of any individual or entity. It is not a substitute for professional advice or services. Any actions you take based on the information provided here are strictly at your own risk. You accept full responsibility for any decisions or outcomes arising from your use of this website and agree to release us from any liability in connection with your use of, or reliance upon, the content or products found herein.