
|
Longhua Technology Group Co., Ltd. (300263.sz) valoración de DCF |
Completamente Editable: Adáptelo A Sus Necesidades En Excel O Sheets
Diseño Profesional: Plantillas Confiables Y Estándares De La Industria
Predeterminadas Para Un Uso Rápido Y Eficiente
Compatible con MAC / PC, completamente desbloqueado
No Se Necesita Experiencia; Fáciles De Seguir
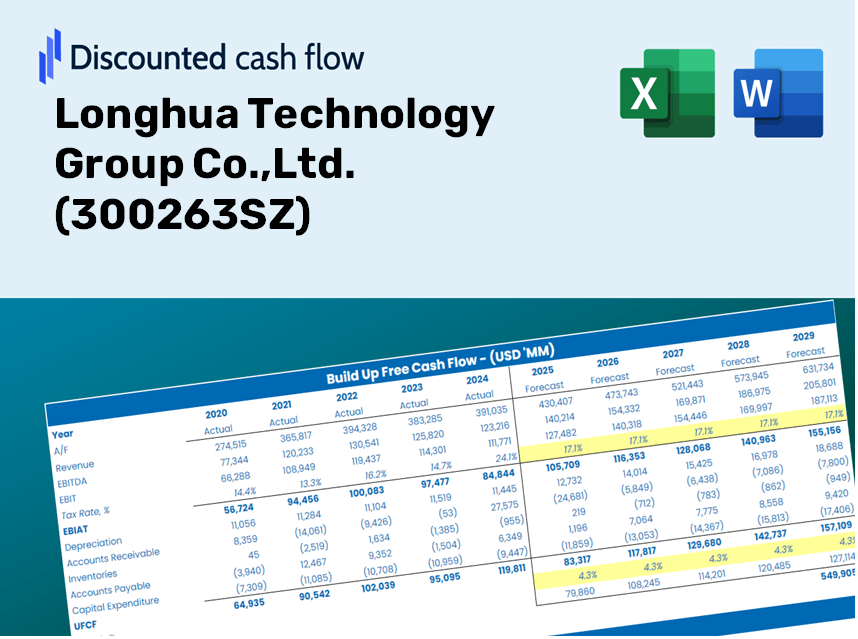
Longhua Technology Group Co.,Ltd. (300263.SZ) Bundle
Ya sea que sea un inversor o analista, esta calculadora DCF (300263SZ) es su recurso de referencia para una valoración precisa. Equipado con datos reales de Longhua Technology Group Co., Ltd., puede ajustar previsiones y observar instantáneamente los efectos.
Discounted Cash Flow (DCF) - (USD MM)
| Year | AY1 2020 |
AY2 2021 |
AY3 2022 |
AY4 2023 |
AY5 2024 |
FY1 2025 |
FY2 2026 |
FY3 2027 |
FY4 2028 |
FY5 2029 |
|---|---|---|---|---|---|---|---|---|---|---|
| Revenue | 1,824.2 | 2,209.1 | 2,301.1 | 2,467.2 | 2,710.7 | 2,997.7 | 3,315.1 | 3,666.0 | 4,054.2 | 4,483.5 |
| Revenue Growth, % | 0 | 21.1 | 4.17 | 7.22 | 9.87 | 10.59 | 10.59 | 10.59 | 10.59 | 10.59 |
| EBITDA | 321.7 | 393.1 | 233.5 | 303.6 | 347.4 | 423.9 | 468.8 | 518.4 | 573.3 | 634.0 |
| EBITDA, % | 17.64 | 17.8 | 10.15 | 12.31 | 12.82 | 14.14 | 14.14 | 14.14 | 14.14 | 14.14 |
| Depreciation | 62.0 | 66.1 | 79.3 | 84.1 | 88.6 | 99.0 | 109.5 | 121.1 | 133.9 | 148.1 |
| Depreciation, % | 3.4 | 2.99 | 3.45 | 3.41 | 3.27 | 3.3 | 3.3 | 3.3 | 3.3 | 3.3 |
| EBIT | 259.7 | 327.0 | 154.1 | 219.5 | 258.8 | 324.8 | 359.2 | 397.3 | 439.3 | 485.8 |
| EBIT, % | 14.24 | 14.8 | 6.7 | 8.9 | 9.55 | 10.84 | 10.84 | 10.84 | 10.84 | 10.84 |
| Total Cash | 599.8 | 964.6 | 807.7 | 888.7 | 814.9 | 1,065.6 | 1,178.4 | 1,303.2 | 1,441.2 | 1,593.7 |
| Total Cash, percent | .0 | .0 | .0 | .0 | .0 | .0 | .0 | .0 | .0 | .0 |
| Account Receivables | 1,270.3 | 1,485.0 | 1,407.2 | 1,638.2 | 1,807.0 | 1,984.9 | 2,195.1 | 2,427.5 | 2,684.5 | 2,968.8 |
| Account Receivables, % | 69.64 | 67.22 | 61.16 | 66.4 | 66.66 | 66.22 | 66.22 | 66.22 | 66.22 | 66.22 |
| Inventories | 547.7 | 686.1 | 750.6 | 815.3 | 979.7 | 976.6 | 1,080.0 | 1,194.3 | 1,320.8 | 1,460.6 |
| Inventories, % | 30.02 | 31.06 | 32.62 | 33.05 | 36.14 | 32.58 | 32.58 | 32.58 | 32.58 | 32.58 |
| Accounts Payable | 969.7 | 802.8 | 728.4 | 891.0 | 546.9 | 1,063.8 | 1,176.5 | 1,301.0 | 1,438.8 | 1,591.1 |
| Accounts Payable, % | 53.16 | 36.34 | 31.65 | 36.12 | 20.17 | 35.49 | 35.49 | 35.49 | 35.49 | 35.49 |
| Capital Expenditure | -161.0 | -153.3 | -144.8 | -213.3 | -285.0 | -247.1 | -273.3 | -302.2 | -334.2 | -369.6 |
| Capital Expenditure, % | -8.83 | -6.94 | -6.29 | -8.65 | -10.52 | -8.24 | -8.24 | -8.24 | -8.24 | -8.24 |
| Tax Rate, % | 32.08 | 32.08 | 32.08 | 32.08 | 32.08 | 32.08 | 32.08 | 32.08 | 32.08 | 32.08 |
| EBITAT | 203.4 | 282.3 | 93.0 | 153.7 | 175.8 | 235.8 | 260.8 | 288.4 | 318.9 | 352.7 |
| Depreciation | ||||||||||
| Changes in Account Receivables | ||||||||||
| Changes in Inventories | ||||||||||
| Changes in Accounts Payable | ||||||||||
| Capital Expenditure | ||||||||||
| UFCF | -743.8 | -324.9 | -33.6 | -108.5 | -698.0 | 429.9 | -103.9 | -114.9 | -127.1 | -140.5 |
| WACC, % | 4.7 | 4.78 | 4.54 | 4.63 | 4.61 | 4.65 | 4.65 | 4.65 | 4.65 | 4.65 |
| PV UFCF | ||||||||||
| SUM PV UFCF | -2.2 | |||||||||
| Long Term Growth Rate, % | 3.50 | |||||||||
| Free cash flow (T + 1) | -145 | |||||||||
| Terminal Value | -12,617 | |||||||||
| Present Terminal Value | -10,051 | |||||||||
| Enterprise Value | -10,053 | |||||||||
| Net Debt | 966 | |||||||||
| Equity Value | -11,019 | |||||||||
| Diluted Shares Outstanding, MM | 874 | |||||||||
| Equity Value Per Share | -12.61 |
Benefits You Will Receive
- Pre-Loaded Financial Model: Leverage Longhua Technology Group Co., Ltd.'s actual data for accurate DCF valuation.
- Comprehensive Forecast Control: Modify revenue growth, profit margins, WACC, and other essential factors.
- Real-Time Calculations: Immediate updates allow you to view results as you implement changes.
- Professional-Grade Template: A polished Excel file specifically crafted for high-quality valuation.
- Flexible and Reusable: Designed for versatility, enabling repeated use for in-depth forecasting.
Key Features
- 🔍 Real-Life Longhua Technology Financials: Pre-filled historical and projected data for Longhua Technology Group Co., Ltd. (300263SZ).
- ✏️ Fully Customizable Inputs: Modify all essential parameters (yellow cells) such as WACC, growth %, and tax rates.
- 📊 Professional DCF Valuation: Integrated formulas calculate the intrinsic value of Longhua Technology using the Discounted Cash Flow method.
- ⚡ Instant Results: View Longhua Technology’s valuation instantly after adjusting inputs.
- Scenario Analysis: Evaluate and compare results for different financial assumptions side-by-side.
How It Operates
- Download the Template: Gain immediate access to the Excel-based LHTG DCF Calculator.
- Input Your Assumptions: Modify the yellow-highlighted cells for growth rates, WACC, margins, and more.
- Instant Calculations: The model automatically recalculates Longhua Technology Group's intrinsic value.
- Test Scenarios: Experiment with different assumptions to assess potential changes in valuation.
- Analyze and Decide: Utilize the outcomes to inform your investment or financial analysis.
Why Opt for Our Financial Calculator?
- All-in-One Solution: Features DCF, WACC, and comprehensive financial ratio analyses in a single platform.
- Flexible Inputs: Modify yellow-highlighted fields to explore different financial scenarios.
- In-Depth Analysis: Automatically computes the intrinsic value and Net Present Value for Longhua Technology Group Co., Ltd. (300263SZ).
- Preloaded Information: Access to historical and projected data for reliable analysis.
- Professional Standards: Perfect for financial analysts, investors, and business consultants alike.
Who Can Benefit from This Product?
- Institutional Investors: Create comprehensive and dependable valuation models for analyzing portfolios, particularly for Longhua Technology Group Co.,Ltd. (300263SZ).
- Corporate Finance Departments: Evaluate various valuation scenarios to inform strategic decisions within the organization.
- Consultants and Financial Advisors: Supply clients with precise valuation insights related to Longhua Technology Group Co.,Ltd. (300263SZ).
- Academics and Learners: Utilize real-time data for hands-on practice in financial modeling and teaching.
- Technology Investors: Gain insights into how technology firms like Longhua Technology Group Co.,Ltd. (300263SZ) are appraised in the financial market.
Contents of the Template
- Pre-Filled DCF Model: Longhua Technology Group’s financial data preloaded for immediate utilization.
- WACC Calculator: Comprehensive calculations for Weighted Average Cost of Capital.
- Financial Ratios: Analyze Longhua Technology Group’s profitability, leverage, and operational efficiency.
- Editable Inputs: Modify assumptions such as growth rates, profit margins, and CAPEX to align with your scenarios.
- Financial Statements: Annual and quarterly reports to facilitate in-depth analysis.
- Interactive Dashboard: Effortlessly visualize essential valuation metrics and outcomes.
Disclaimer
All information, articles, and product details provided on this website are for general informational and educational purposes only. We do not claim any ownership over, nor do we intend to infringe upon, any trademarks, copyrights, logos, brand names, or other intellectual property mentioned or depicted on this site. Such intellectual property remains the property of its respective owners, and any references here are made solely for identification or informational purposes, without implying any affiliation, endorsement, or partnership.
We make no representations or warranties, express or implied, regarding the accuracy, completeness, or suitability of any content or products presented. Nothing on this website should be construed as legal, tax, investment, financial, medical, or other professional advice. In addition, no part of this site—including articles or product references—constitutes a solicitation, recommendation, endorsement, advertisement, or offer to buy or sell any securities, franchises, or other financial instruments, particularly in jurisdictions where such activity would be unlawful.
All content is of a general nature and may not address the specific circumstances of any individual or entity. It is not a substitute for professional advice or services. Any actions you take based on the information provided here are strictly at your own risk. You accept full responsibility for any decisions or outcomes arising from your use of this website and agree to release us from any liability in connection with your use of, or reliance upon, the content or products found herein.