
|
China Recursos Boya Bio-Pharmaceutical Group Co., Ltd. (300294.sz) Valoración de DCF |
Completamente Editable: Adáptelo A Sus Necesidades En Excel O Sheets
Diseño Profesional: Plantillas Confiables Y Estándares De La Industria
Predeterminadas Para Un Uso Rápido Y Eficiente
Compatible con MAC / PC, completamente desbloqueado
No Se Necesita Experiencia; Fáciles De Seguir
China Resources Boya Bio-pharmaceutical Group Co., Ltd. (300294.SZ) Bundle
Ya sea que sea un inversor o analista, esta calculadora DCF (300294SZ) es su recurso de referencia para una valoración precisa. Llenos de datos reales de China Recursos Boya Bio-Pharmaceutical Group Co., Ltd., puede ajustar los pronósticos e inmediatamente observar los efectos.
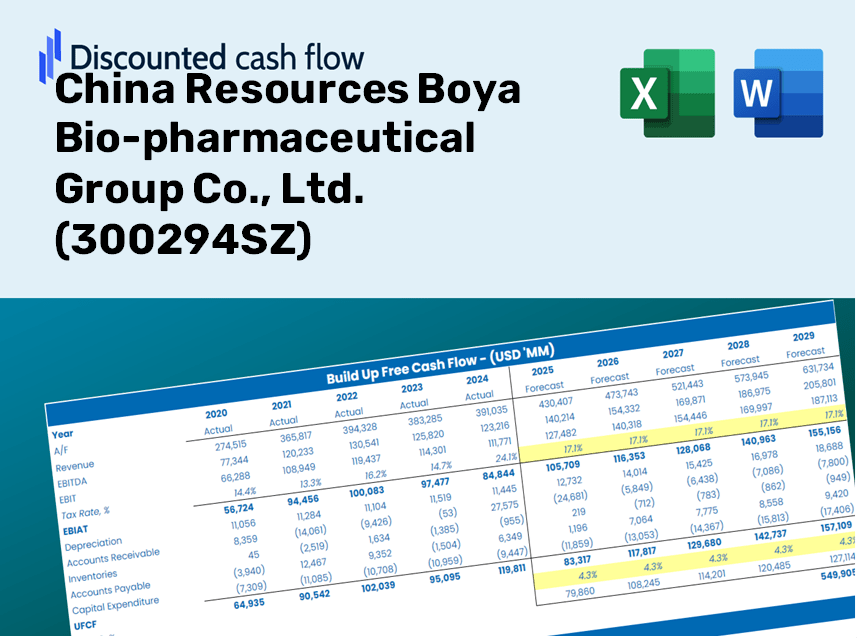
Discounted Cash Flow (DCF) - (USD MM)
| Year | AY1 2020 |
AY2 2021 |
AY3 2022 |
AY4 2023 |
AY5 2024 |
FY1 2025 |
FY2 2026 |
FY3 2027 |
FY4 2028 |
FY5 2029 |
|---|---|---|---|---|---|---|---|---|---|---|
| Revenue | 2,513.0 | 2,650.5 | 2,758.7 | 2,652.0 | 1,734.9 | 1,609.6 | 1,493.3 | 1,385.4 | 1,285.3 | 1,192.5 |
| Revenue Growth, % | 0 | 5.47 | 4.08 | -3.87 | -34.58 | -7.22 | -7.22 | -7.22 | -7.22 | -7.22 |
| EBITDA | 411.5 | 510.6 | 600.4 | 624.4 | 519.8 | 357.0 | 331.2 | 307.3 | 285.1 | 264.5 |
| EBITDA, % | 16.38 | 19.27 | 21.76 | 23.54 | 29.96 | 22.18 | 22.18 | 22.18 | 22.18 | 22.18 |
| Depreciation | 81.3 | 96.2 | 93.2 | 95.0 | 97.7 | 62.6 | 58.1 | 53.9 | 50.0 | 46.4 |
| Depreciation, % | 3.24 | 3.63 | 3.38 | 3.58 | 5.63 | 3.89 | 3.89 | 3.89 | 3.89 | 3.89 |
| EBIT | 330.2 | 414.5 | 507.2 | 529.4 | 422.1 | 294.4 | 273.1 | 253.4 | 235.1 | 218.1 |
| EBIT, % | 13.14 | 15.64 | 18.38 | 19.96 | 24.33 | 18.29 | 18.29 | 18.29 | 18.29 | 18.29 |
| Total Cash | 753.9 | 4,283.7 | 4,725.5 | 5,323.9 | 3,499.0 | 1,384.2 | 1,284.2 | 1,191.5 | 1,105.4 | 1,025.5 |
| Total Cash, percent | .0 | .0 | .0 | .0 | .0 | .0 | .0 | .0 | .0 | .0 |
| Account Receivables | 734.2 | 671.7 | 668.2 | 275.9 | 549.2 | 389.0 | 360.9 | 334.8 | 310.6 | 288.2 |
| Account Receivables, % | 29.22 | 25.34 | 24.22 | 10.4 | 31.66 | 24.17 | 24.17 | 24.17 | 24.17 | 24.17 |
| Inventories | 689.5 | 676.8 | 667.0 | 556.9 | 995.4 | 500.7 | 464.5 | 430.9 | 399.8 | 370.9 |
| Inventories, % | 27.44 | 25.54 | 24.18 | 21 | 57.38 | 31.11 | 31.11 | 31.11 | 31.11 | 31.11 |
| Accounts Payable | 285.9 | 277.5 | 303.5 | 126.3 | 357.6 | 187.4 | 173.9 | 161.3 | 149.7 | 138.9 |
| Accounts Payable, % | 11.38 | 10.47 | 11 | 4.76 | 20.61 | 11.64 | 11.64 | 11.64 | 11.64 | 11.64 |
| Capital Expenditure | -142.5 | -68.1 | -138.4 | -87.5 | -197.8 | -90.0 | -83.5 | -77.5 | -71.9 | -66.7 |
| Capital Expenditure, % | -5.67 | -2.57 | -5.02 | -3.3 | -11.4 | -5.59 | -5.59 | -5.59 | -5.59 | -5.59 |
| Tax Rate, % | 16.9 | 16.9 | 16.9 | 16.9 | 16.9 | 16.9 | 16.9 | 16.9 | 16.9 | 16.9 |
| EBITAT | 261.7 | 322.3 | 412.0 | 355.4 | 350.8 | 228.7 | 212.2 | 196.9 | 182.7 | 169.5 |
| Depreciation | ||||||||||
| Changes in Account Receivables | ||||||||||
| Changes in Inventories | ||||||||||
| Changes in Accounts Payable | ||||||||||
| Capital Expenditure | ||||||||||
| UFCF | -937.3 | 417.1 | 406.1 | 688.1 | -229.8 | 686.1 | 237.6 | 220.4 | 204.5 | 189.7 |
| WACC, % | 4.54 | 4.54 | 4.54 | 4.54 | 4.54 | 4.54 | 4.54 | 4.54 | 4.54 | 4.54 |
| PV UFCF | ||||||||||
| SUM PV UFCF | 1,389.8 | |||||||||
| Long Term Growth Rate, % | 3.00 | |||||||||
| Free cash flow (T + 1) | 195 | |||||||||
| Terminal Value | 12,703 | |||||||||
| Present Terminal Value | 10,175 | |||||||||
| Enterprise Value | 11,564 | |||||||||
| Net Debt | -1,293 | |||||||||
| Equity Value | 12,857 | |||||||||
| Diluted Shares Outstanding, MM | 504 | |||||||||
| Equity Value Per Share | 25.50 |
What You Will Receive
- Customizable Excel Template: A comprehensive Excel-based DCF Calculator featuring pre-loaded financial data for China Resources Boya Bio-pharmaceutical Group Co., Ltd. (300294SZ).
- Accurate Historical Insights: Access to historical data along with forward-thinking projections (displayed in the highlighted cells).
- Flexible Forecasting: Adjust forecast parameters such as revenue growth, EBITDA %, and WACC to suit your analysis.
- Instant Calculations: Quickly observe how your inputs affect the valuation of China Resources Boya Bio-pharmaceutical Group Co., Ltd. (300294SZ).
- Professional-Grade Tool: Designed for investors, CFOs, consultants, and financial analysts.
- Intuitive Layout: Organized for straightforward use, complete with step-by-step guidance.
Key Features
- Comprehensive DCF Calculator: Offers detailed unlevered and levered DCF valuation models tailored for China Resources Boya Bio-pharmaceutical Group Co., Ltd. (300294SZ).
- WACC Tool: Pre-designed Weighted Average Cost of Capital sheet with easily customizable inputs specific to the pharmaceutical sector.
- Modifiable Forecast Assumptions: Adjust projections for growth rates, capital expenditures, and discount rates as needed.
- Integrated Financial Ratios: Assess profitability, leverage, and efficiency ratios specifically for China Resources Boya Bio-pharmaceutical Group Co., Ltd. (300294SZ).
- Visual Dashboard and Charts: Intuitive graphical representations summarize essential valuation metrics for straightforward analysis.
How It Works
- Step 1: Download the Excel file.
- Step 2: Review the pre-filled financial data and forecasts for China Resources Boya Bio-pharmaceutical Group Co., Ltd. (300294SZ).
- Step 3: Adjust key inputs such as revenue growth, WACC, and tax rates (highlighted cells).
- Step 4: Observe the DCF model refresh in real-time as you modify your assumptions.
- Step 5: Evaluate the outputs and leverage the results for your investment strategies.
Why Choose This Calculator for China Resources Boya Bio-pharmaceutical Group Co., Ltd. (300294SZ)?
- All-in-One Solution: Integrates DCF, WACC, and a variety of financial ratio analyses tailored for the bio-pharmaceutical sector.
- Flexible Inputs: Modify the highlighted cells to explore different financial scenarios relevant to (300294SZ).
- In-Depth Analysis: Automatically computes the intrinsic value and Net Present Value for China Resources Boya.
- Ready-to-Use Data: Comes with historical and projected data to provide reliable benchmarks.
- Top-Notch Standards: Perfect for financial analysts, investors, and consultants focused on the bio-pharmaceutical industry.
Who Can Benefit from This Product?
- Investors: Assess the valuation of China Resources Boya Bio-pharmaceutical Group Co., Ltd. (300294SZ) before making buy or sell decisions.
- CFOs and Financial Analysts: Enhance the efficiency of valuation processes and validate financial projections.
- Startup Founders: Gain insights on how leading pharmaceutical companies like China Resources Boya Bio-pharmaceutical Group Co., Ltd. (300294SZ) are valued.
- Consultants: Create comprehensive valuation reports for your clients.
- Students and Educators: Utilize practical data to practice and teach valuation methodologies.
What the Template Includes
- Preloaded CRB Data: Historical and projected financial information for China Resources Boya Bio-pharmaceutical Group Co., Ltd. (300294SZ), such as revenue, EBIT, and capital expenditures.
- DCF and WACC Models: Expert-level spreadsheets designed for calculating intrinsic value and Weighted Average Cost of Capital.
- Editable Inputs: Yellow-highlighted cells for customizing revenue growth, tax rates, and discount rates.
- Financial Statements: Detailed annual and quarterly financials for comprehensive analysis.
- Key Ratios: Profitability, leverage, and efficiency ratios for assessing financial performance.
- Dashboard and Charts: Visual representations of valuation results and underlying assumptions.
Disclaimer
All information, articles, and product details provided on this website are for general informational and educational purposes only. We do not claim any ownership over, nor do we intend to infringe upon, any trademarks, copyrights, logos, brand names, or other intellectual property mentioned or depicted on this site. Such intellectual property remains the property of its respective owners, and any references here are made solely for identification or informational purposes, without implying any affiliation, endorsement, or partnership.
We make no representations or warranties, express or implied, regarding the accuracy, completeness, or suitability of any content or products presented. Nothing on this website should be construed as legal, tax, investment, financial, medical, or other professional advice. In addition, no part of this site—including articles or product references—constitutes a solicitation, recommendation, endorsement, advertisement, or offer to buy or sell any securities, franchises, or other financial instruments, particularly in jurisdictions where such activity would be unlawful.
All content is of a general nature and may not address the specific circumstances of any individual or entity. It is not a substitute for professional advice or services. Any actions you take based on the information provided here are strictly at your own risk. You accept full responsibility for any decisions or outcomes arising from your use of this website and agree to release us from any liability in connection with your use of, or reliance upon, the content or products found herein.