
|
Sinocare Inc. (300298.SZ) DCF Valoración |
Completamente Editable: Adáptelo A Sus Necesidades En Excel O Sheets
Diseño Profesional: Plantillas Confiables Y Estándares De La Industria
Predeterminadas Para Un Uso Rápido Y Eficiente
Compatible con MAC / PC, completamente desbloqueado
No Se Necesita Experiencia; Fáciles De Seguir
Sinocare Inc. (300298.SZ) Bundle
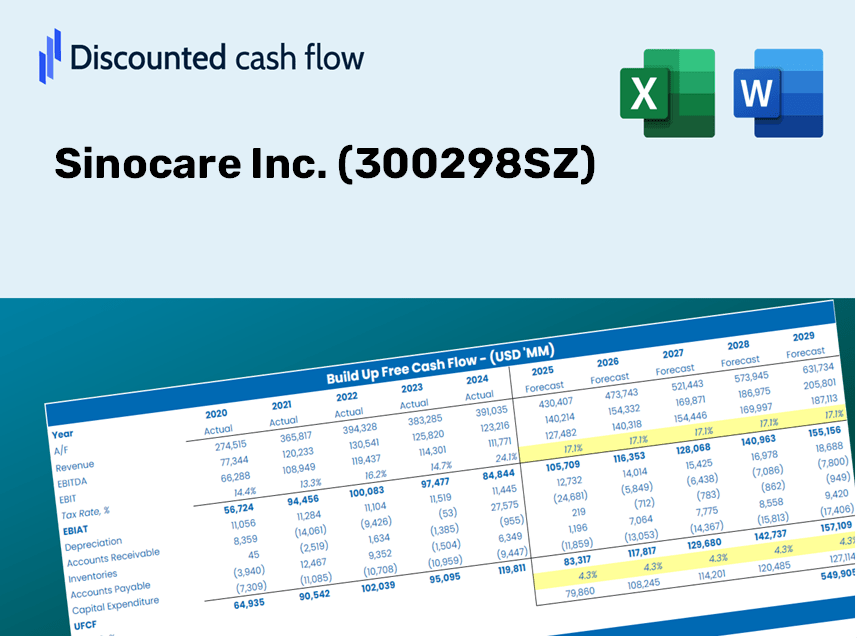
¡Evalúe el futuro financiero de Sinocare Inc. (300298SZ) como un experto! Esta calculadora DCF (300298SZ) le proporciona finanzas precargadas y la flexibilidad para modificar el crecimiento de los ingresos, WACC, los márgenes y otros supuestos esenciales para alinearse con sus proyecciones.
Discounted Cash Flow (DCF) - (USD MM)
| Year | AY1 2020 |
AY2 2021 |
AY3 2022 |
AY4 2023 |
AY5 2024 |
FY1 2025 |
FY2 2026 |
FY3 2027 |
FY4 2028 |
FY5 2029 |
|---|---|---|---|---|---|---|---|---|---|---|
| Revenue | 2,015.2 | 2,361.3 | 3,952.4 | 4,058.8 | 4,443.1 | 5,517.4 | 6,851.5 | 8,508.2 | 10,565.4 | 13,120.0 |
| Revenue Growth, % | 0 | 17.17 | 67.38 | 2.69 | 9.47 | 24.18 | 24.18 | 24.18 | 24.18 | 24.18 |
| EBITDA | 441.4 | 353.8 | 584.4 | 599.2 | 621.4 | 887.4 | 1,102.0 | 1,368.4 | 1,699.3 | 2,110.2 |
| EBITDA, % | 21.9 | 14.98 | 14.79 | 14.76 | 13.99 | 16.08 | 16.08 | 16.08 | 16.08 | 16.08 |
| Depreciation | 81.8 | 97.0 | 165.8 | 189.7 | 187.3 | 234.5 | 291.2 | 361.7 | 449.1 | 557.7 |
| Depreciation, % | 4.06 | 4.11 | 4.19 | 4.67 | 4.22 | 4.25 | 4.25 | 4.25 | 4.25 | 4.25 |
| EBIT | 359.5 | 256.8 | 418.6 | 409.5 | 434.1 | 652.9 | 810.8 | 1,006.8 | 1,250.2 | 1,552.5 |
| EBIT, % | 17.84 | 10.87 | 10.59 | 10.09 | 9.77 | 11.83 | 11.83 | 11.83 | 11.83 | 11.83 |
| Total Cash | 1,139.9 | 932.4 | 843.5 | 816.0 | 954.7 | 1,754.4 | 2,178.5 | 2,705.3 | 3,359.4 | 4,171.7 |
| Total Cash, percent | .0 | .0 | .0 | .0 | .0 | .0 | .0 | .0 | .0 | .0 |
| Account Receivables | 272.9 | 263.0 | .0 | 548.7 | 662.1 | 585.9 | 727.6 | 903.5 | 1,122.0 | 1,393.3 |
| Account Receivables, % | 13.54 | 11.14 | 0 | 13.52 | 14.9 | 10.62 | 10.62 | 10.62 | 10.62 | 10.62 |
| Inventories | 312.8 | 330.8 | 416.8 | 632.4 | 662.8 | 778.8 | 967.1 | 1,201.0 | 1,491.4 | 1,852.0 |
| Inventories, % | 15.52 | 14.01 | 10.55 | 15.58 | 14.92 | 14.12 | 14.12 | 14.12 | 14.12 | 14.12 |
| Accounts Payable | 174.0 | 181.9 | 315.1 | 305.0 | 345.8 | 437.1 | 542.8 | 674.0 | 837.0 | 1,039.4 |
| Accounts Payable, % | 8.64 | 7.7 | 7.97 | 7.52 | 7.78 | 7.92 | 7.92 | 7.92 | 7.92 | 7.92 |
| Capital Expenditure | -275.6 | -403.8 | -311.2 | -346.6 | -186.7 | -567.1 | -704.2 | -874.4 | -1,085.9 | -1,348.4 |
| Capital Expenditure, % | -13.67 | -17.1 | -7.87 | -8.54 | -4.2 | -10.28 | -10.28 | -10.28 | -10.28 | -10.28 |
| Tax Rate, % | 17.45 | 17.45 | 17.45 | 17.45 | 17.45 | 17.45 | 17.45 | 17.45 | 17.45 | 17.45 |
| EBITAT | 271.2 | 199.9 | 347.0 | 468.5 | 358.3 | 546.8 | 679.0 | 843.1 | 1,047.0 | 1,300.1 |
| Depreciation | ||||||||||
| Changes in Account Receivables | ||||||||||
| Changes in Inventories | ||||||||||
| Changes in Accounts Payable | ||||||||||
| Capital Expenditure | ||||||||||
| UFCF | -334.2 | -107.1 | 511.8 | -462.7 | 256.0 | 265.7 | 41.7 | 51.8 | 64.3 | 79.9 |
| WACC, % | 4.76 | 4.77 | 4.8 | 4.88 | 4.8 | 4.8 | 4.8 | 4.8 | 4.8 | 4.8 |
| PV UFCF | ||||||||||
| SUM PV UFCF | 453.0 | |||||||||
| Long Term Growth Rate, % | 3.00 | |||||||||
| Free cash flow (T + 1) | 82 | |||||||||
| Terminal Value | 4,565 | |||||||||
| Present Terminal Value | 3,611 | |||||||||
| Enterprise Value | 4,064 | |||||||||
| Net Debt | -247 | |||||||||
| Equity Value | 4,311 | |||||||||
| Diluted Shares Outstanding, MM | 554 | |||||||||
| Equity Value Per Share | 7.78 |
What You Will Receive
- Genuine Sinocare Data: Preloaded financial metrics – covering everything from revenue to EBIT – based on actual and projected figures.
- Comprehensive Customization: Modify all essential parameters (yellow cells) such as WACC, growth %, and tax rates.
- Instant Valuation Updates: Automatic recalculations allowing you to assess the effects of changes on Sinocare’s fair value.
- Flexible Excel Template: Designed for easy modifications, scenario analysis, and detailed forecasting.
- Efficient and Precise: Avoid the hassle of building models from the ground up while ensuring accuracy and adaptability.
Key Features
- Comprehensive DCF Calculator: Offers detailed unlevered and levered DCF valuation models tailored for Sinocare Inc. (300298SZ).
- WACC Calculator: Features a pre-configured Weighted Average Cost of Capital sheet with adjustable inputs.
- Customizable Forecast Assumptions: Adjust growth rates, capital expenditures, and discount rates as needed.
- Integrated Financial Ratios: Evaluate profitability, leverage, and efficiency ratios specifically for Sinocare Inc. (300298SZ).
- Visual Dashboard and Charts: Graphical representations summarize essential valuation metrics for straightforward analysis.
How It Works
- Step 1: Download the Excel file.
- Step 2: Review the pre-filled data for Sinocare Inc. (300298SZ), including both historical and forecasted figures.
- Step 3: Modify the key assumptions (highlighted in yellow) based on your analysis.
- Step 4: Observe the automatic recalculations to determine Sinocare Inc.'s (300298SZ) intrinsic value.
- Step 5: Utilize the generated outputs for your investment decisions or reporting needs.
Why Choose the Sinocare Inc. Calculator?
- Accuracy: Leverage real Sinocare financials for precise data.
- Flexibility: Tailored for users to experiment and adjust inputs effortlessly.
- Time-Saving: Bypass the complexities of creating a DCF model from the ground up.
- Professional-Grade: Crafted with the expertise and usability expected at the CFO level.
- User-Friendly: Intuitive design makes it accessible for users without advanced financial modeling skills.
Who Should Use Sinocare Inc. (300298SZ)?
- Investors: Evaluate Sinocare’s valuation before making stock trades.
- CFOs and Financial Analysts: Optimize valuation methods and assess financial forecasts.
- Startup Founders: Gain insights into how large public firms like Sinocare are appraised.
- Consultants: Provide detailed valuation analyses for your clients.
- Students and Educators: Utilize actual market data to learn and teach valuation strategies.
Contents of the Template
- Operating and Balance Sheet Data: Pre-filled historical data and forecasts for Sinocare Inc. (300298SZ), encompassing revenue, EBITDA, EBIT, and capital expenditures.
- WACC Calculation: A dedicated worksheet for determining the Weighted Average Cost of Capital (WACC), featuring parameters such as Beta, risk-free rate, and share price.
- DCF Valuation (Unlevered and Levered): Customizable Discounted Cash Flow models that illustrate intrinsic value along with comprehensive calculations.
- Financial Statements: Pre-loaded annual and quarterly financial statements to facilitate thorough analysis.
- Key Ratios: A collection of profitability, leverage, and efficiency ratios pertinent to Sinocare Inc. (300298SZ).
- Dashboard and Charts: A visual overview of valuation results and underlying assumptions for easy interpretation of findings.
Disclaimer
All information, articles, and product details provided on this website are for general informational and educational purposes only. We do not claim any ownership over, nor do we intend to infringe upon, any trademarks, copyrights, logos, brand names, or other intellectual property mentioned or depicted on this site. Such intellectual property remains the property of its respective owners, and any references here are made solely for identification or informational purposes, without implying any affiliation, endorsement, or partnership.
We make no representations or warranties, express or implied, regarding the accuracy, completeness, or suitability of any content or products presented. Nothing on this website should be construed as legal, tax, investment, financial, medical, or other professional advice. In addition, no part of this site—including articles or product references—constitutes a solicitation, recommendation, endorsement, advertisement, or offer to buy or sell any securities, franchises, or other financial instruments, particularly in jurisdictions where such activity would be unlawful.
All content is of a general nature and may not address the specific circumstances of any individual or entity. It is not a substitute for professional advice or services. Any actions you take based on the information provided here are strictly at your own risk. You accept full responsibility for any decisions or outcomes arising from your use of this website and agree to release us from any liability in connection with your use of, or reliance upon, the content or products found herein.