
|
Zhongji Innolight Co., Ltd. (300308.SZ) Valoración de DCF |
Completamente Editable: Adáptelo A Sus Necesidades En Excel O Sheets
Diseño Profesional: Plantillas Confiables Y Estándares De La Industria
Predeterminadas Para Un Uso Rápido Y Eficiente
Compatible con MAC / PC, completamente desbloqueado
No Se Necesita Experiencia; Fáciles De Seguir
Zhongji Innolight Co., Ltd. (300308.SZ) Bundle
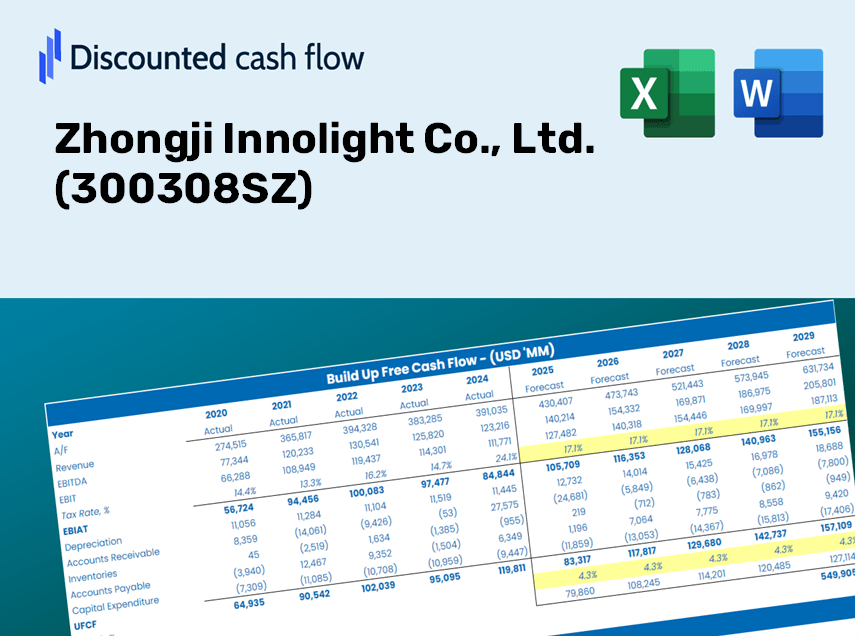
¡Simplifique la valoración de Zhongji Innolight Co., Ltd. (300308SZ) con esta calculadora DCF personalizable! Con el verdadero Zhongji Innolight Co., Ltd. (300308SZ) financieras y entradas de pronóstico ajustables, puede probar escenarios y descubrir Zhongji Innolight Co., Ltd. (300308SZ) valor razonable en minutos.
Discounted Cash Flow (DCF) - (USD MM)
| Year | AY1 2020 |
AY2 2021 |
AY3 2022 |
AY4 2023 |
AY5 2024 |
FY1 2025 |
FY2 2026 |
FY3 2027 |
FY4 2028 |
FY5 2029 |
|---|---|---|---|---|---|---|---|---|---|---|
| Revenue | 7,049.6 | 7,695.4 | 9,641.8 | 10,718.0 | 23,862.2 | 32,548.9 | 44,398.0 | 60,560.6 | 82,607.0 | 112,679.2 |
| Revenue Growth, % | 0 | 9.16 | 25.29 | 11.16 | 122.64 | 36.4 | 36.4 | 36.4 | 36.4 | 36.4 |
| EBITDA | 1,055.2 | 1,212.7 | 1,669.7 | 2,573.8 | 6,461.0 | 6,453.4 | 8,802.7 | 12,007.2 | 16,378.3 | 22,340.7 |
| EBITDA, % | 14.97 | 15.76 | 17.32 | 24.01 | 27.08 | 19.83 | 19.83 | 19.83 | 19.83 | 19.83 |
| Depreciation | 331.0 | 406.5 | 444.7 | 470.1 | 636.6 | 1,409.0 | 1,921.9 | 2,621.6 | 3,576.0 | 4,877.8 |
| Depreciation, % | 4.7 | 5.28 | 4.61 | 4.39 | 2.67 | 4.33 | 4.33 | 4.33 | 4.33 | 4.33 |
| EBIT | 724.1 | 806.2 | 1,225.0 | 2,103.7 | 5,824.4 | 5,044.4 | 6,880.8 | 9,385.6 | 12,802.4 | 17,462.9 |
| EBIT, % | 10.27 | 10.48 | 12.7 | 19.63 | 24.41 | 15.5 | 15.5 | 15.5 | 15.5 | 15.5 |
| Total Cash | 1,910.4 | 3,514.6 | 3,850.1 | 3,733.3 | 5,576.4 | 11,125.4 | 15,175.5 | 20,700.0 | 28,235.6 | 38,514.5 |
| Total Cash, percent | .0 | .0 | .0 | .0 | .0 | .0 | .0 | .0 | .0 | .0 |
| Account Receivables | 1,965.4 | 2,533.7 | 1,784.7 | 2,948.9 | 4,957.7 | 8,306.8 | 11,330.8 | 15,455.6 | 21,082.1 | 28,756.8 |
| Account Receivables, % | 27.88 | 32.93 | 18.51 | 27.51 | 20.78 | 25.52 | 25.52 | 25.52 | 25.52 | 25.52 |
| Inventories | 3,774.3 | 3,799.2 | 3,888.0 | 4,294.7 | 7,051.3 | 13,856.3 | 18,900.5 | 25,781.0 | 35,166.3 | 47,968.2 |
| Inventories, % | 53.54 | 49.37 | 40.32 | 40.07 | 29.55 | 42.57 | 42.57 | 42.57 | 42.57 | 42.57 |
| Accounts Payable | 1,670.4 | 1,441.0 | 1,378.2 | 2,163.5 | 3,507.8 | 5,963.0 | 8,133.7 | 11,094.7 | 15,133.7 | 20,642.9 |
| Accounts Payable, % | 23.69 | 18.73 | 14.29 | 20.19 | 14.7 | 18.32 | 18.32 | 18.32 | 18.32 | 18.32 |
| Capital Expenditure | -956.1 | -839.6 | -791.8 | -1,704.5 | -2,866.2 | -3,944.8 | -5,380.9 | -7,339.8 | -10,011.8 | -13,656.4 |
| Capital Expenditure, % | -13.56 | -10.91 | -8.21 | -15.9 | -12.01 | -12.12 | -12.12 | -12.12 | -12.12 | -12.12 |
| Tax Rate, % | 14.56 | 14.56 | 14.56 | 14.56 | 14.56 | 14.56 | 14.56 | 14.56 | 14.56 | 14.56 |
| EBITAT | 635.0 | 736.5 | 1,109.4 | 1,834.5 | 4,976.6 | 4,461.9 | 6,086.2 | 8,301.8 | 11,324.0 | 15,446.4 |
| Depreciation | ||||||||||
| Changes in Account Receivables | ||||||||||
| Changes in Inventories | ||||||||||
| Changes in Accounts Payable | ||||||||||
| Capital Expenditure | ||||||||||
| UFCF | -4,059.3 | -519.2 | 1,359.8 | -185.5 | -674.1 | -5,772.9 | -3,270.2 | -4,460.7 | -6,084.6 | -8,299.7 |
| WACC, % | 9.38 | 9.38 | 9.38 | 9.38 | 9.38 | 9.38 | 9.38 | 9.38 | 9.38 | 9.38 |
| PV UFCF | ||||||||||
| SUM PV UFCF | -20,970.9 | |||||||||
| Long Term Growth Rate, % | 4.00 | |||||||||
| Free cash flow (T + 1) | -8,632 | |||||||||
| Terminal Value | -160,382 | |||||||||
| Present Terminal Value | -102,430 | |||||||||
| Enterprise Value | -123,401 | |||||||||
| Net Debt | -2,999 | |||||||||
| Equity Value | -120,402 | |||||||||
| Diluted Shares Outstanding, MM | 1,116 | |||||||||
| Equity Value Per Share | -107.91 |
What You Will Receive
- Customizable Excel Template: An entirely editable Excel-based DCF Calculator featuring pre-filled financial data for Zhongji Innolight Co., Ltd. (300308SZ).
- Authentic Data: Access to historical performance data and future projections (highlighted in the yellow cells).
- Flexible Forecasting: Adjust key assumptions such as revenue growth, EBITDA percentage, and WACC at your convenience.
- Instant Calculations: Quickly observe how your modifications affect the valuation of Zhongji Innolight Co., Ltd. (300308SZ).
- Professional Resource: Designed specifically for investors, CFOs, consultants, and financial analysts.
- Intuitive Design: Organized for simplicity and usability, complete with detailed step-by-step guidance.
Key Features
- Real-Life ZJIL Data: Equipped with Zhongji Innolight’s historical financial information and future projections.
- Fully Customizable Inputs: Modify revenue growth, profit margins, WACC, tax rates, and capital expenditures to suit your needs.
- Dynamic Valuation Model: Automatically refreshes Net Present Value (NPV) and intrinsic value based on user inputs.
- Scenario Testing: Develop multiple forecasting scenarios to evaluate different valuation results.
- User-Friendly Design: Intuitive, organized, and suitable for both professionals and newcomers.
How It Functions
- Download: Obtain the pre-configured Excel file containing financial data for Zhongji Innolight Co., Ltd. (300308SZ).
- Customize: Modify forecasts such as revenue growth, EBITDA %, and WACC to suit your analysis.
- Update in Real-Time: The intrinsic value and NPV calculations refresh automatically as you make changes.
- Test Scenarios: Develop various projections and effortlessly compare results.
- Make Informed Decisions: Leverage the valuation outcomes to inform your investment approach.
Why Opt for This Calculator?
- Precise Financial Data: Utilize accurate financials from Zhongji Innolight Co., Ltd. to achieve trustworthy valuation outcomes.
- Customizable Features: Modify essential parameters such as growth rates, WACC, and tax rates to align with your forecasts.
- Efficiency Boost: Ready-made calculations save you from starting from the ground up.
- Professional Quality Tool: Tailored for investors, analysts, and consultants in the field.
- Easy to Use: User-friendly interface and clear, step-by-step guidance accommodate all users.
Who Can Benefit from This Product?
- Investors: Evaluate Zhongji Innolight's valuation prior to making investment decisions.
- CFOs and Financial Analysts: Enhance valuation methodologies and assess financial forecasts.
- Startup Founders: Gain insights into the valuation practices of established public companies like Zhongji Innolight (300308SZ).
- Consultants: Provide comprehensive valuation assessments for your clients.
- Students and Educators: Utilize current market data to learn and teach valuation strategies effectively.
Contents of the Template
- Comprehensive DCF Model: An editable template featuring detailed valuation calculations.
- Real-World Data: Historical and projected financials for Zhongji Innolight Co., Ltd. (300308SZ) preloaded for your analysis.
- Customizable Parameters: Modify WACC, growth rates, and tax assumptions to experiment with different scenarios.
- Financial Statements: Complete annual and quarterly breakdowns for enhanced insights.
- Key Ratios: Integrated analysis for profitability, efficiency, and leverage metrics.
- Dashboard with Visual Outputs: Intuitive charts and tables that present clear and actionable results.
Disclaimer
All information, articles, and product details provided on this website are for general informational and educational purposes only. We do not claim any ownership over, nor do we intend to infringe upon, any trademarks, copyrights, logos, brand names, or other intellectual property mentioned or depicted on this site. Such intellectual property remains the property of its respective owners, and any references here are made solely for identification or informational purposes, without implying any affiliation, endorsement, or partnership.
We make no representations or warranties, express or implied, regarding the accuracy, completeness, or suitability of any content or products presented. Nothing on this website should be construed as legal, tax, investment, financial, medical, or other professional advice. In addition, no part of this site—including articles or product references—constitutes a solicitation, recommendation, endorsement, advertisement, or offer to buy or sell any securities, franchises, or other financial instruments, particularly in jurisdictions where such activity would be unlawful.
All content is of a general nature and may not address the specific circumstances of any individual or entity. It is not a substitute for professional advice or services. Any actions you take based on the information provided here are strictly at your own risk. You accept full responsibility for any decisions or outcomes arising from your use of this website and agree to release us from any liability in connection with your use of, or reliance upon, the content or products found herein.