
|
Sino Wealth Electronic Ltd. (300327.SZ) DCF Valoración |
Completamente Editable: Adáptelo A Sus Necesidades En Excel O Sheets
Diseño Profesional: Plantillas Confiables Y Estándares De La Industria
Predeterminadas Para Un Uso Rápido Y Eficiente
Compatible con MAC / PC, completamente desbloqueado
No Se Necesita Experiencia; Fáciles De Seguir
Sino Wealth Electronic Ltd. (300327.SZ) Bundle
¡Explore Sino Wealth Electronic Ltd. (300327SZ) Potencial financiero con nuestra calculadora DCF fácil de usar! Ingrese sus proyecciones para el crecimiento, los márgenes y los gastos para calcular el valor intrínseco de Sino Wealth Ltd. (300327SZ) y mejorar su enfoque de inversión.
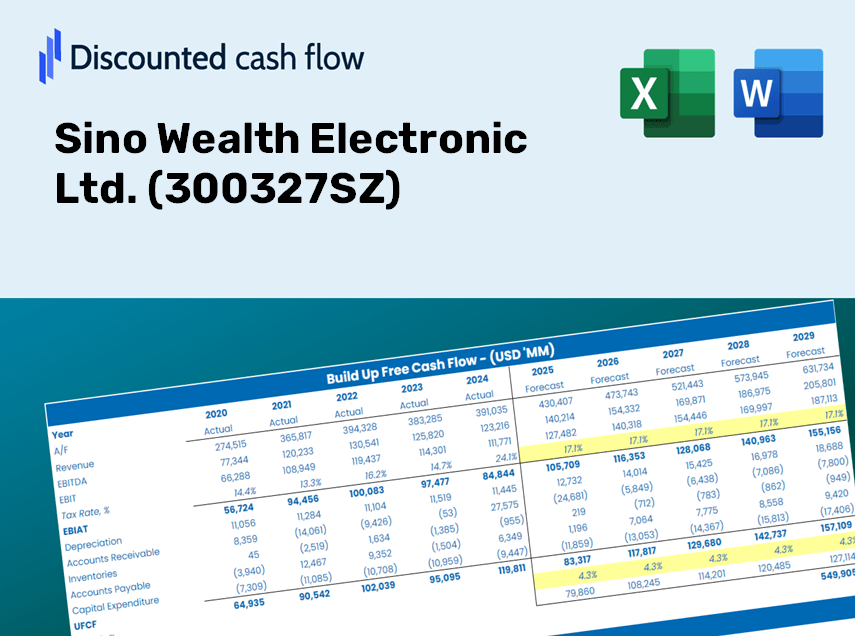
Discounted Cash Flow (DCF) - (USD MM)
| Year | AY1 2020 |
AY2 2021 |
AY3 2022 |
AY4 2023 |
AY5 2024 |
FY1 2025 |
FY2 2026 |
FY3 2027 |
FY4 2028 |
FY5 2029 |
|---|---|---|---|---|---|---|---|---|---|---|
| Revenue | 1,012.3 | 1,493.9 | 1,601.9 | 1,300.2 | 1,343.4 | 1,475.5 | 1,620.4 | 1,779.6 | 1,954.5 | 2,146.5 |
| Revenue Growth, % | 0 | 47.58 | 7.23 | -18.83 | 3.32 | 9.83 | 9.83 | 9.83 | 9.83 | 9.83 |
| EBITDA | 241.0 | 425.2 | 340.8 | 169.4 | 126.3 | 283.2 | 311.0 | 341.6 | 375.1 | 412.0 |
| EBITDA, % | 23.8 | 28.46 | 21.27 | 13.03 | 9.4 | 19.19 | 19.19 | 19.19 | 19.19 | 19.19 |
| Depreciation | 22.9 | 27.8 | 29.3 | 34.8 | 36.6 | 33.5 | 36.8 | 40.4 | 44.4 | 48.8 |
| Depreciation, % | 2.27 | 1.86 | 1.83 | 2.68 | 2.73 | 2.27 | 2.27 | 2.27 | 2.27 | 2.27 |
| EBIT | 218.0 | 397.4 | 311.5 | 134.6 | 89.6 | 249.7 | 274.2 | 301.1 | 330.7 | 363.2 |
| EBIT, % | 21.54 | 26.6 | 19.44 | 10.35 | 6.67 | 16.92 | 16.92 | 16.92 | 16.92 | 16.92 |
| Total Cash | 686.4 | 642.3 | 435.7 | 401.2 | 401.6 | 586.5 | 644.1 | 707.4 | 776.9 | 853.2 |
| Total Cash, percent | .0 | .0 | .0 | .0 | .0 | .0 | .0 | .0 | .0 | .0 |
| Account Receivables | 174.2 | 223.5 | 228.2 | 308.1 | 229.2 | 257.2 | 282.5 | 310.3 | 340.8 | 374.2 |
| Account Receivables, % | 17.2 | 14.96 | 14.25 | 23.7 | 17.06 | 17.43 | 17.43 | 17.43 | 17.43 | 17.43 |
| Inventories | 109.1 | 216.5 | 557.3 | 710.3 | 614.1 | 473.3 | 519.8 | 570.9 | 627.0 | 688.6 |
| Inventories, % | 10.78 | 14.49 | 34.79 | 54.63 | 45.71 | 32.08 | 32.08 | 32.08 | 32.08 | 32.08 |
| Accounts Payable | 121.2 | 147.8 | 226.6 | 214.9 | 132.6 | 184.2 | 202.3 | 222.1 | 244.0 | 267.9 |
| Accounts Payable, % | 11.98 | 9.89 | 14.14 | 16.53 | 9.87 | 12.48 | 12.48 | 12.48 | 12.48 | 12.48 |
| Capital Expenditure | -107.9 | -128.2 | -102.3 | -72.8 | -183.7 | -132.5 | -145.5 | -159.8 | -175.5 | -192.8 |
| Capital Expenditure, % | -10.66 | -8.58 | -6.39 | -5.6 | -13.68 | -8.98 | -8.98 | -8.98 | -8.98 | -8.98 |
| Tax Rate, % | -52.37 | -52.37 | -52.37 | -52.37 | -52.37 | -52.37 | -52.37 | -52.37 | -52.37 | -52.37 |
| EBITAT | 209.8 | 371.3 | 323.8 | 189.4 | 136.6 | 244.5 | 268.5 | 294.9 | 323.9 | 355.7 |
| Depreciation | ||||||||||
| Changes in Account Receivables | ||||||||||
| Changes in Inventories | ||||||||||
| Changes in Accounts Payable | ||||||||||
| Capital Expenditure | ||||||||||
| UFCF | -37.2 | 140.6 | -15.9 | -93.1 | 82.2 | 309.9 | 106.1 | 116.6 | 128.0 | 140.6 |
| WACC, % | 8.98 | 8.98 | 8.98 | 8.98 | 8.98 | 8.98 | 8.98 | 8.98 | 8.98 | 8.98 |
| PV UFCF | ||||||||||
| SUM PV UFCF | 646.0 | |||||||||
| Long Term Growth Rate, % | 3.00 | |||||||||
| Free cash flow (T + 1) | 145 | |||||||||
| Terminal Value | 2,421 | |||||||||
| Present Terminal Value | 1,575 | |||||||||
| Enterprise Value | 2,221 | |||||||||
| Net Debt | -247 | |||||||||
| Equity Value | 2,468 | |||||||||
| Diluted Shares Outstanding, MM | 340 | |||||||||
| Equity Value Per Share | 7.27 |
Your Benefits
- Customizable Excel Template: An adaptable Excel-based DCF Calculator featuring pre-filled financials for Sino Wealth Electronic Ltd. (300327SZ).
- Authentic Data: Access to historical data and forward-looking estimates presented in the highlighted cells.
- Flexible Forecasting: Modify key forecast parameters such as revenue growth, EBITDA %, and WACC according to your analysis.
- Instant Calculations: Quickly observe how your inputs influence the valuation of Sino Wealth Electronic Ltd. (300327SZ).
- Professional Resource: Designed specifically for investors, CFOs, consultants, and financial analysts.
- Intuitive Design: Organized for simplicity and accessibility, complete with comprehensive step-by-step guidance.
Key Features
- Customizable Forecast Variables: Adjust essential metrics such as revenue growth, EBITDA %, and capital investments.
- Instant DCF Valuation: Automatically computes intrinsic value, NPV, and additional outputs in real-time.
- Industry-Leading Precision: Leverages Sino Wealth Electronic Ltd.'s [300327SZ] actual financial data for credible valuation results.
- Simplified Scenario Analysis: Effortlessly evaluate various assumptions and assess their impacts.
- Efficiency Booster: Streamline your process by avoiding the construction of intricate valuation models from the ground up.
How It Works
- Step 1: Download the prebuilt Excel template featuring data for Sino Wealth Electronic Ltd. (300327SZ).
- Step 2: Review the pre-filled sheets to familiarize yourself with the key metrics.
- Step 3: Adjust forecasts and assumptions in the editable yellow cells (WACC, growth, margins).
- Step 4: Instantly see the recalculated results, including the intrinsic value of Sino Wealth Electronic Ltd. (300327SZ).
- Step 5: Utilize the outputs to make informed investment decisions or create detailed reports.
Why Opt for the Sino Wealth Electronic Ltd. (300327SZ) Calculator?
- User-Friendly Interface: Perfectly crafted for both novices and seasoned professionals.
- Customizable Parameters: Effortlessly adjust inputs to tailor your financial analysis.
- Real-Time Updates: Experience immediate changes to Sino Wealth’s valuation as you modify inputs.
- Pre-Configured Data: Comes with Sino Wealth’s actual financial metrics for swift evaluations.
- Preferred by Experts: Valued by investors and analysts for making well-informed choices.
Who Can Benefit from Sino Wealth Electronic Ltd. (300327SZ)?
- Investors: Empower your decision-making with our advanced valuation tools designed for precision.
- Financial Analysts: Streamline your workflow with our customizable DCF model, ready to meet your needs.
- Consultants: Effortlessly modify the template for impactful presentations and reports tailored for clients.
- Finance Enthusiasts: Enhance your knowledge of valuation methods with practical, real-world applications.
- Educators and Students: Leverage our resources as a hands-on learning tool in finance courses.
Components of the Template
- Historical Data: Contains Sino Wealth Electronic Ltd.'s (300327SZ) previous financial results and foundational forecasts.
- DCF and Levered DCF Models: Comprehensive templates for assessing the intrinsic value of Sino Wealth Electronic Ltd. (300327SZ).
- WACC Sheet: Ready-to-use calculations for the Weighted Average Cost of Capital.
- Editable Inputs: Adjust essential drivers such as growth rates, EBITDA percentages, and CAPEX projections.
- Quarterly and Annual Statements: Detailed analysis of Sino Wealth Electronic Ltd.'s (300327SZ) financial performance.
- Interactive Dashboard: Dynamically visualize valuation results and future projections.
Disclaimer
All information, articles, and product details provided on this website are for general informational and educational purposes only. We do not claim any ownership over, nor do we intend to infringe upon, any trademarks, copyrights, logos, brand names, or other intellectual property mentioned or depicted on this site. Such intellectual property remains the property of its respective owners, and any references here are made solely for identification or informational purposes, without implying any affiliation, endorsement, or partnership.
We make no representations or warranties, express or implied, regarding the accuracy, completeness, or suitability of any content or products presented. Nothing on this website should be construed as legal, tax, investment, financial, medical, or other professional advice. In addition, no part of this site—including articles or product references—constitutes a solicitation, recommendation, endorsement, advertisement, or offer to buy or sell any securities, franchises, or other financial instruments, particularly in jurisdictions where such activity would be unlawful.
All content is of a general nature and may not address the specific circumstances of any individual or entity. It is not a substitute for professional advice or services. Any actions you take based on the information provided here are strictly at your own risk. You accept full responsibility for any decisions or outcomes arising from your use of this website and agree to release us from any liability in connection with your use of, or reliance upon, the content or products found herein.