
|
Dongguan Eontec Co., Ltd. (300328.SZ) Valoración de DCF |
Completamente Editable: Adáptelo A Sus Necesidades En Excel O Sheets
Diseño Profesional: Plantillas Confiables Y Estándares De La Industria
Predeterminadas Para Un Uso Rápido Y Eficiente
Compatible con MAC / PC, completamente desbloqueado
No Se Necesita Experiencia; Fáciles De Seguir
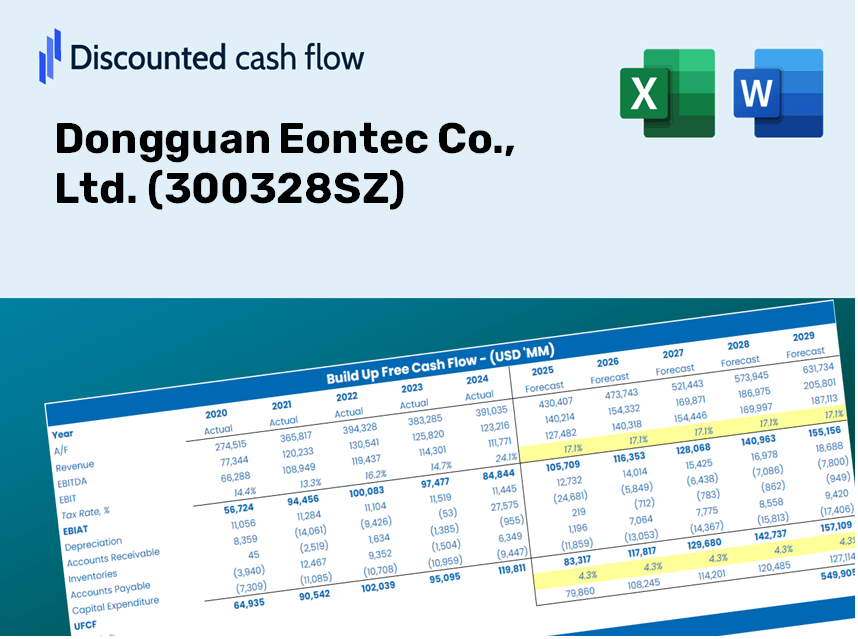
Dongguan Eontec Co., Ltd. (300328.SZ) Bundle
¡Explore el potencial financiero de Dongguan Eontec Co., Ltd. (300328SZ) con nuestra calculadora DCF fácil de usar! Simplemente ingrese sus suposiciones con respecto al crecimiento, los márgenes y los costos para determinar el valor intrínseco de Dongguan Eontec Co., Ltd. (300328SZ) y refinar su estrategia de inversión.
Discounted Cash Flow (DCF) - (USD MM)
| Year | AY1 2020 |
AY2 2021 |
AY3 2022 |
AY4 2023 |
AY5 2024 |
FY1 2025 |
FY2 2026 |
FY3 2027 |
FY4 2028 |
FY5 2029 |
|---|---|---|---|---|---|---|---|---|---|---|
| Revenue | 945.5 | 1,069.8 | 1,616.0 | 1,706.9 | 1,652.5 | 1,927.8 | 2,249.0 | 2,623.8 | 3,060.9 | 3,570.9 |
| Revenue Growth, % | 0 | 13.15 | 51.06 | 5.63 | -3.19 | 16.66 | 16.66 | 16.66 | 16.66 | 16.66 |
| EBITDA | 55.0 | 4.2 | 59.4 | 54.6 | 65.4 | 65.7 | 76.6 | 89.4 | 104.3 | 121.6 |
| EBITDA, % | 5.81 | 0.38932 | 3.68 | 3.2 | 3.96 | 3.41 | 3.41 | 3.41 | 3.41 | 3.41 |
| Depreciation | 64.2 | 72.3 | 81.8 | 98.7 | 102.0 | 117.8 | 137.5 | 160.4 | 187.1 | 218.3 |
| Depreciation, % | 6.79 | 6.76 | 5.06 | 5.78 | 6.17 | 6.11 | 6.11 | 6.11 | 6.11 | 6.11 |
| EBIT | -9.2 | -68.1 | -22.4 | -44.2 | -36.7 | -52.2 | -60.9 | -71.0 | -82.8 | -96.7 |
| EBIT, % | -0.97514 | -6.37 | -1.38 | -2.59 | -2.22 | -2.71 | -2.71 | -2.71 | -2.71 | -2.71 |
| Total Cash | 380.8 | 224.1 | 307.0 | 316.3 | 235.5 | 435.7 | 508.3 | 593.0 | 691.8 | 807.1 |
| Total Cash, percent | .0 | .0 | .0 | .0 | .0 | .0 | .0 | .0 | .0 | .0 |
| Account Receivables | 329.1 | 420.9 | 625.5 | 606.0 | 606.9 | 713.6 | 832.5 | 971.3 | 1,133.1 | 1,321.9 |
| Account Receivables, % | 34.81 | 39.34 | 38.71 | 35.5 | 36.72 | 37.02 | 37.02 | 37.02 | 37.02 | 37.02 |
| Inventories | 164.9 | 257.8 | 360.0 | 317.9 | 284.0 | 384.1 | 448.1 | 522.8 | 609.9 | 711.5 |
| Inventories, % | 17.44 | 24.1 | 22.28 | 18.62 | 17.19 | 19.93 | 19.93 | 19.93 | 19.93 | 19.93 |
| Accounts Payable | 213.2 | 302.3 | 624.7 | 354.3 | 702.3 | 588.8 | 686.9 | 801.4 | 934.9 | 1,090.6 |
| Accounts Payable, % | 22.55 | 28.26 | 38.65 | 20.75 | 42.5 | 30.54 | 30.54 | 30.54 | 30.54 | 30.54 |
| Capital Expenditure | -157.1 | -286.5 | -317.8 | -127.5 | -177.9 | -313.5 | -365.7 | -426.6 | -497.7 | -580.7 |
| Capital Expenditure, % | -16.62 | -26.78 | -19.67 | -7.47 | -10.77 | -16.26 | -16.26 | -16.26 | -16.26 | -16.26 |
| Tax Rate, % | 104.48 | 104.48 | 104.48 | 104.48 | 104.48 | 104.48 | 104.48 | 104.48 | 104.48 | 104.48 |
| EBITAT | -7.9 | -60.4 | 3.2 | 7.3 | 1.6 | -18.2 | -21.3 | -24.8 | -28.9 | -33.8 |
| Depreciation | ||||||||||
| Changes in Account Receivables | ||||||||||
| Changes in Inventories | ||||||||||
| Changes in Accounts Payable | ||||||||||
| Capital Expenditure | ||||||||||
| UFCF | -381.7 | -370.3 | -217.3 | -230.2 | 306.7 | -534.2 | -334.3 | -390.0 | -455.0 | -530.8 |
| WACC, % | 4.53 | 4.54 | 4.29 | 4.29 | 4.29 | 4.39 | 4.39 | 4.39 | 4.39 | 4.39 |
| PV UFCF | ||||||||||
| SUM PV UFCF | -1,972.8 | |||||||||
| Long Term Growth Rate, % | 4.00 | |||||||||
| Free cash flow (T + 1) | -552 | |||||||||
| Terminal Value | -142,449 | |||||||||
| Present Terminal Value | -114,926 | |||||||||
| Enterprise Value | -116,898 | |||||||||
| Net Debt | 338 | |||||||||
| Equity Value | -117,237 | |||||||||
| Diluted Shares Outstanding, MM | 690 | |||||||||
| Equity Value Per Share | -169.80 |
Your Benefits with Dongguan Eontec Co., Ltd. (300328SZ)
- Customizable Forecast Parameters: Modify variables (growth %, margins, WACC) effortlessly to explore various scenarios.
- Industry-Specific Data: Dongguan Eontec’s financial metrics pre-loaded for a swift analysis start.
- Instant DCF Calculations: The template computes Net Present Value (NPV) and intrinsic value automatically.
- Professional and Flexible Design: A well-structured Excel model designed to meet your valuation requirements.
- Tailored for Analysts and Investors: Perfect for assessing projections, confirming strategies, and enhancing efficiency.
Key Features
- Comprehensive Data: Access Dongguan Eontec Co., Ltd.'s historical financial statements along with pre-filled forecasts.
- Customizable Inputs: Adjust parameters like WACC, tax rates, revenue growth, and EBITDA margins as needed.
- Real-Time Calculations: Instantly view the intrinsic value of Dongguan Eontec Co., Ltd. recalculating live.
- Insightful Visualizations: Dashboard charts illustrate valuation outcomes and essential metrics clearly.
- Designed for Precision: A professional-grade tool tailored for analysts, investors, and finance professionals.
How It Operates
- Step 1: Download the Excel spreadsheet.
- Step 2: Examine the pre-filled data for Dongguan Eontec Co., Ltd. (300328SZ) including historical and projected figures.
- Step 3: Modify key assumptions (highlighted in yellow) based on your insights.
- Step 4: Observe the automatic recalculations reflecting the intrinsic value of Dongguan Eontec Co., Ltd. (300328SZ).
- Step 5: Utilize the results for investment strategy or financial reporting purposes.
Why Opt for Dongguan Eontec Co., Ltd. (300328SZ)?
- Precision: Utilizes authentic Eontec financial data to ensure precise results.
- Versatility: Built to allow users to easily adjust and experiment with various inputs.
- Efficiency: Eliminate the need to create a financial model from the ground up.
- High-Caliber: Crafted with the accuracy and usability expected from CFO-level professionals.
- Intuitive: Simple to navigate, even for individuals without extensive financial modeling skills.
Who Can Benefit from This Product?
- Investors: Evaluate Dongguan Eontec Co., Ltd.'s (300328SZ) market position before making investment decisions.
- CFOs and Financial Analysts: Enhance valuation methodologies and assess forecasts for better financial planning.
- Startup Founders: Gain insights into the valuation strategies of established companies like Dongguan Eontec Co., Ltd. (300328SZ).
- Consultants: Create comprehensive valuation reports tailored for your clients’ needs.
- Students and Educators: Utilize real data to learn and teach effective valuation methods.
Contents of the Template
- Historical Data: Contains Dongguan Eontec Co., Ltd.’s past financial records and baseline projections.
- DCF and Levered DCF Models: Comprehensive templates for assessing the intrinsic value of Dongguan Eontec Co., Ltd. (300328SZ).
- WACC Sheet: Pre-structured calculations for the Weighted Average Cost of Capital.
- Editable Inputs: Adjust key variables such as growth rates, EBITDA %, and CAPEX assumptions.
- Quarterly and Annual Statements: A thorough breakdown of Dongguan Eontec Co., Ltd.'s financial performance.
- Interactive Dashboard: Dynamically visualize valuation outcomes and projections.
Disclaimer
All information, articles, and product details provided on this website are for general informational and educational purposes only. We do not claim any ownership over, nor do we intend to infringe upon, any trademarks, copyrights, logos, brand names, or other intellectual property mentioned or depicted on this site. Such intellectual property remains the property of its respective owners, and any references here are made solely for identification or informational purposes, without implying any affiliation, endorsement, or partnership.
We make no representations or warranties, express or implied, regarding the accuracy, completeness, or suitability of any content or products presented. Nothing on this website should be construed as legal, tax, investment, financial, medical, or other professional advice. In addition, no part of this site—including articles or product references—constitutes a solicitation, recommendation, endorsement, advertisement, or offer to buy or sell any securities, franchises, or other financial instruments, particularly in jurisdictions where such activity would be unlawful.
All content is of a general nature and may not address the specific circumstances of any individual or entity. It is not a substitute for professional advice or services. Any actions you take based on the information provided here are strictly at your own risk. You accept full responsibility for any decisions or outcomes arising from your use of this website and agree to release us from any liability in connection with your use of, or reliance upon, the content or products found herein.