
|
Beijing Sojo Electric Co., Ltd. (300444.sz) Valoración de DCF |
Completamente Editable: Adáptelo A Sus Necesidades En Excel O Sheets
Diseño Profesional: Plantillas Confiables Y Estándares De La Industria
Predeterminadas Para Un Uso Rápido Y Eficiente
Compatible con MAC / PC, completamente desbloqueado
No Se Necesita Experiencia; Fáciles De Seguir
Beijing SOJO Electric Co., Ltd. (300444.SZ) Bundle
¡Ahorre tiempo y mejore la precisión con nuestra calculadora DCF (300444SZ)! Utilizando datos en tiempo real de Beijing Sojo Electric Co., Ltd. y suposiciones personalizables, esta herramienta le permite pronosticar, analizar y evaluar (300444SZ) al igual que un inversor experimentado.
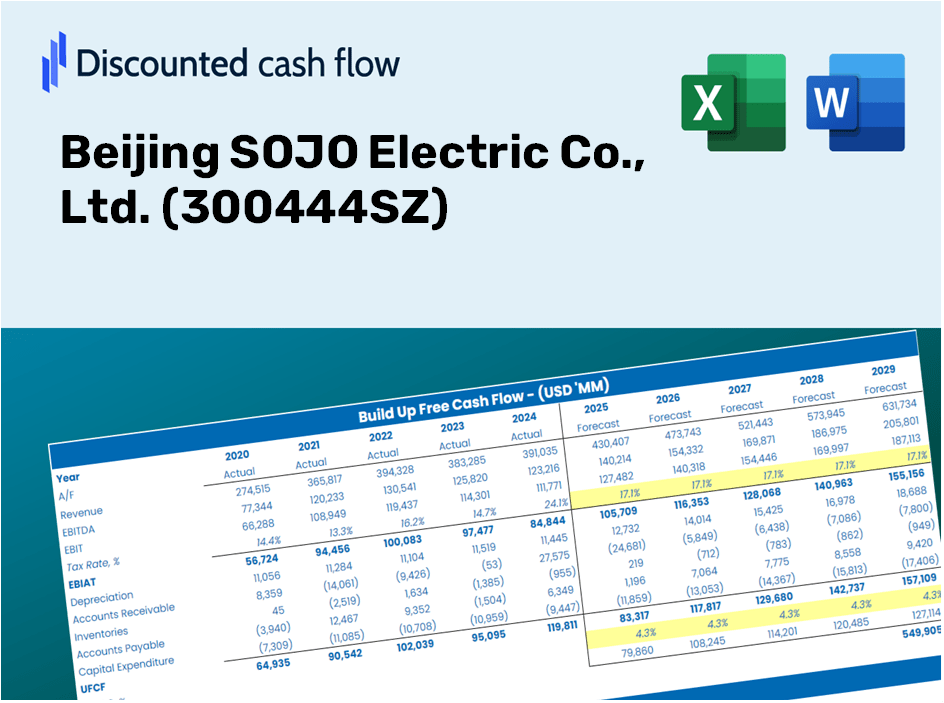
Discounted Cash Flow (DCF) - (USD MM)
| Year | AY1 2020 |
AY2 2021 |
AY3 2022 |
AY4 2023 |
AY5 2024 |
FY1 2025 |
FY2 2026 |
FY3 2027 |
FY4 2028 |
FY5 2029 |
|---|---|---|---|---|---|---|---|---|---|---|
| Revenue | 1,231.3 | 1,171.3 | 1,882.2 | 3,139.8 | 3,472.5 | 3,806.6 | 4,172.9 | 4,574.4 | 5,014.6 | 5,497.1 |
| Revenue Growth, % | 0 | -4.88 | 60.69 | 66.82 | 10.6 | 9.62 | 9.62 | 9.62 | 9.62 | 9.62 |
| EBITDA | 102.2 | -94.3 | -95.4 | 220.8 | 234.0 | 68.1 | 74.7 | 81.9 | 89.7 | 98.4 |
| EBITDA, % | 8.3 | -8.05 | -5.07 | 7.03 | 6.74 | 1.79 | 1.79 | 1.79 | 1.79 | 1.79 |
| Depreciation | 47.8 | 45.8 | 72.4 | 74.3 | 95.8 | 127.7 | 140.0 | 153.4 | 168.2 | 184.4 |
| Depreciation, % | 3.88 | 3.91 | 3.85 | 2.37 | 2.76 | 3.35 | 3.35 | 3.35 | 3.35 | 3.35 |
| EBIT | 54.4 | -140.1 | -167.9 | 146.5 | 138.2 | -59.6 | -65.3 | -71.6 | -78.5 | -86.0 |
| EBIT, % | 4.41 | -11.97 | -8.92 | 4.67 | 3.98 | -1.56 | -1.56 | -1.56 | -1.56 | -1.56 |
| Total Cash | 284.5 | 403.4 | 266.6 | 492.5 | 580.9 | 792.7 | 869.0 | 952.6 | 1,044.2 | 1,144.7 |
| Total Cash, percent | .0 | .0 | .0 | .0 | .0 | .0 | .0 | .0 | .0 | .0 |
| Account Receivables | 1,032.2 | 987.7 | 1,138.3 | 1,455.9 | 2,243.7 | 2,585.6 | 2,834.3 | 3,107.1 | 3,406.0 | 3,733.7 |
| Account Receivables, % | 83.83 | 84.32 | 60.48 | 46.37 | 64.61 | 67.92 | 67.92 | 67.92 | 67.92 | 67.92 |
| Inventories | 294.5 | 484.1 | 784.0 | 949.1 | 1,631.8 | 1,401.8 | 1,536.7 | 1,684.5 | 1,846.6 | 2,024.3 |
| Inventories, % | 23.92 | 41.33 | 41.65 | 30.23 | 46.99 | 36.82 | 36.82 | 36.82 | 36.82 | 36.82 |
| Accounts Payable | 687.9 | 808.8 | 844.1 | 971.9 | 2,029.7 | 1,973.1 | 2,163.0 | 2,371.1 | 2,599.3 | 2,849.3 |
| Accounts Payable, % | 55.87 | 69.05 | 44.85 | 30.96 | 58.45 | 51.83 | 51.83 | 51.83 | 51.83 | 51.83 |
| Capital Expenditure | -233.9 | -372.5 | -94.5 | -443.5 | -226.9 | -582.2 | -638.2 | -699.6 | -767.0 | -840.8 |
| Capital Expenditure, % | -18.99 | -31.8 | -5.02 | -14.13 | -6.53 | -15.29 | -15.29 | -15.29 | -15.29 | -15.29 |
| Tax Rate, % | 21.62 | 21.62 | 21.62 | 21.62 | 21.62 | 21.62 | 21.62 | 21.62 | 21.62 | 21.62 |
| EBITAT | 80.3 | -101.2 | -144.3 | 129.9 | 108.3 | -50.7 | -55.5 | -60.9 | -66.7 | -73.1 |
| Depreciation | ||||||||||
| Changes in Account Receivables | ||||||||||
| Changes in Inventories | ||||||||||
| Changes in Accounts Payable | ||||||||||
| Capital Expenditure | ||||||||||
| UFCF | -744.5 | -452.0 | -581.5 | -594.2 | -435.6 | -673.5 | -747.6 | -819.5 | -898.4 | -984.8 |
| WACC, % | 4.46 | 4.24 | 4.35 | 4.37 | 4.29 | 4.35 | 4.35 | 4.35 | 4.35 | 4.35 |
| PV UFCF | ||||||||||
| SUM PV UFCF | -3,607.4 | |||||||||
| Long Term Growth Rate, % | 4.00 | |||||||||
| Free cash flow (T + 1) | -1,024 | |||||||||
| Terminal Value | -296,460 | |||||||||
| Present Terminal Value | -239,661 | |||||||||
| Enterprise Value | -243,268 | |||||||||
| Net Debt | 1,165 | |||||||||
| Equity Value | -244,433 | |||||||||
| Diluted Shares Outstanding, MM | 799 | |||||||||
| Equity Value Per Share | -305.99 |
What You Will Receive
- Dynamic Forecast Inputs: Effortlessly adjust key assumptions (growth %, margins, WACC) to explore various scenarios.
- Relevant Financial Data: Beijing SOJO Electric Co., Ltd.’s [300444SZ] financial information pre-loaded to enhance your analysis.
- Automatic DCF Calculations: The model computes Net Present Value (NPV) and intrinsic value for you seamlessly.
- Tailored and Professional Design: A sophisticated Excel template that meets your valuation requirements.
- Designed for Analysts and Investors: Perfect for testing forecasts, confirming strategies, and optimizing your time.
Key Features
- 🔍 Real-Life SOJO Financials: Pre-filled historical and projected data for Beijing SOJO Electric Co., Ltd. (300444SZ).
- ✏️ Fully Customizable Inputs: Modify all essential parameters (yellow cells) such as WACC, growth %, and tax rates.
- 📊 Professional DCF Valuation: Integrated formulas assess SOJO's intrinsic value using the Discounted Cash Flow method.
- ⚡ Instant Results: View SOJO's valuation in real-time after making adjustments.
- Scenario Analysis: Evaluate and compare different outcomes for various financial assumptions side-by-side.
How It Functions
- Step 1: Download the ready-to-use Excel template featuring data from Beijing SOJO Electric Co., Ltd. (300444SZ).
- Step 2: Navigate through the pre-filled sheets to familiarize yourself with the essential metrics.
- Step 3: Adjust forecasts and assumptions in the editable yellow cells (WACC, growth rates, margins).
- Step 4: Instantly view updated results, including the intrinsic value of Beijing SOJO Electric Co., Ltd. (300444SZ).
- Step 5: Make well-informed investment choices or create reports based on the output data.
Why Choose Beijing SOJO Electric Co., Ltd. (300444SZ)?
- Time-Efficient: Skip the hassle of developing a financial model from the ground up – our tools are ready for immediate application.
- Enhanced Precision: Utilize dependable financial data and methodologies to minimize valuation discrepancies.
- Completely Customizable: Adjust the model to align with your forecasts and assumptions.
- User-Friendly: Intuitive charts and outputs facilitate straightforward analysis of your results.
- Endorsed by Professionals: Crafted for experts who prioritize accuracy and functionality.
Who Should Use This Product?
- Individual Investors: Make informed choices regarding the purchase or sale of Beijing SOJO Electric Co., Ltd. (300444SZ) stock.
- Financial Analysts: Enhance valuation processes with ready-to-use financial models specific to Beijing SOJO Electric Co., Ltd. (300444SZ).
- Consultants: Provide professional valuation insights on Beijing SOJO Electric Co., Ltd. (300444SZ) to clients quickly and accurately.
- Business Owners: Gain insights into how established companies like Beijing SOJO Electric Co., Ltd. (300444SZ) are valued to inform your strategic decisions.
- Finance Students: Explore valuation techniques using real-world data and scenarios related to Beijing SOJO Electric Co., Ltd. (300444SZ).
Contents of the Template
- Detailed DCF Model: Editable template featuring extensive valuation calculations.
- Realistic Financial Data: Beijing SOJO Electric Co., Ltd.'s historical and projected financials preloaded for thorough analysis.
- Adjustable Parameters: Tailor WACC, growth rates, and tax assumptions to explore various scenarios.
- Comprehensive Financial Statements: Complete annual and quarterly data for in-depth insights.
- Essential Ratios: Integrated analysis for profitability, efficiency, and leverage metrics.
- Interactive Dashboard with Visual Outputs: Charts and tables providing clear, actionable results.
Disclaimer
All information, articles, and product details provided on this website are for general informational and educational purposes only. We do not claim any ownership over, nor do we intend to infringe upon, any trademarks, copyrights, logos, brand names, or other intellectual property mentioned or depicted on this site. Such intellectual property remains the property of its respective owners, and any references here are made solely for identification or informational purposes, without implying any affiliation, endorsement, or partnership.
We make no representations or warranties, express or implied, regarding the accuracy, completeness, or suitability of any content or products presented. Nothing on this website should be construed as legal, tax, investment, financial, medical, or other professional advice. In addition, no part of this site—including articles or product references—constitutes a solicitation, recommendation, endorsement, advertisement, or offer to buy or sell any securities, franchises, or other financial instruments, particularly in jurisdictions where such activity would be unlawful.
All content is of a general nature and may not address the specific circumstances of any individual or entity. It is not a substitute for professional advice or services. Any actions you take based on the information provided here are strictly at your own risk. You accept full responsibility for any decisions or outcomes arising from your use of this website and agree to release us from any liability in connection with your use of, or reliance upon, the content or products found herein.