
|
Shenzhen Forms Syntron Information Co., Ltd. (300468.sz) Valoración de DCF |
Completamente Editable: Adáptelo A Sus Necesidades En Excel O Sheets
Diseño Profesional: Plantillas Confiables Y Estándares De La Industria
Predeterminadas Para Un Uso Rápido Y Eficiente
Compatible con MAC / PC, completamente desbloqueado
No Se Necesita Experiencia; Fáciles De Seguir
Shenzhen Forms Syntron Information Co., Ltd. (300468.SZ) Bundle
¡Obtenga información sobre sus formularios Shenzhen Syntron Information Co., Ltd. (300468SZ) Análisis de valoración utilizando nuestra calculadora DCF de última generación! Esta plantilla de Excel viene precargada con datos reales (300468SZ), lo que le permite ajustar los pronósticos y los supuestos para determinar con precisión el valor intrínseco de Shenzhen Forms Syntron Information Co., Ltd.
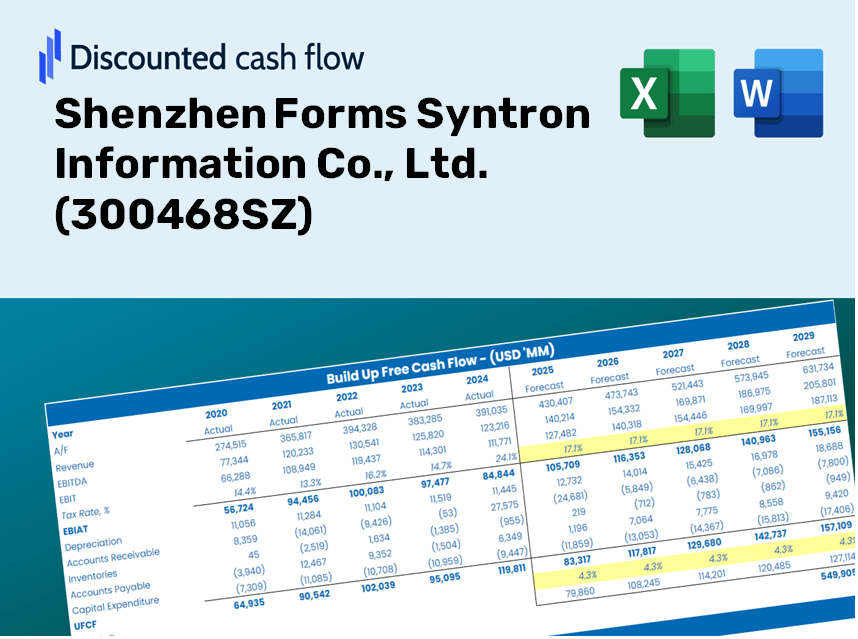
Discounted Cash Flow (DCF) - (USD MM)
| Year | AY1 2020 |
AY2 2021 |
AY3 2022 |
AY4 2023 |
AY5 2024 |
FY1 2025 |
FY2 2026 |
FY3 2027 |
FY4 2028 |
FY5 2029 |
|---|---|---|---|---|---|---|---|---|---|---|
| Revenue | 574.0 | 641.5 | 664.1 | 730.4 | 740.4 | 789.7 | 842.3 | 898.3 | 958.2 | 1,022.0 |
| Revenue Growth, % | 0 | 11.77 | 3.52 | 9.99 | 1.36 | 6.66 | 6.66 | 6.66 | 6.66 | 6.66 |
| EBITDA | 91.0 | 99.6 | 84.3 | 80.2 | 103.8 | 109.1 | 116.3 | 124.1 | 132.4 | 141.2 |
| EBITDA, % | 15.86 | 15.52 | 12.69 | 10.98 | 14.02 | 13.81 | 13.81 | 13.81 | 13.81 | 13.81 |
| Depreciation | 16.5 | 27.5 | 35.4 | 31.6 | 29.8 | 32.9 | 35.1 | 37.5 | 39.9 | 42.6 |
| Depreciation, % | 2.87 | 4.28 | 5.34 | 4.33 | 4.02 | 4.17 | 4.17 | 4.17 | 4.17 | 4.17 |
| EBIT | 74.5 | 72.1 | 48.8 | 48.5 | 74.1 | 76.2 | 81.2 | 86.6 | 92.4 | 98.6 |
| EBIT, % | 12.99 | 11.24 | 7.35 | 6.64 | 10 | 9.64 | 9.64 | 9.64 | 9.64 | 9.64 |
| Total Cash | 485.2 | 475.1 | 964.0 | 1,085.9 | 1,200.1 | 724.3 | 772.5 | 823.9 | 878.8 | 937.3 |
| Total Cash, percent | .0 | .0 | .0 | .0 | .0 | .0 | .0 | .0 | .0 | .0 |
| Account Receivables | 230.2 | 256.6 | 200.1 | 163.7 | 135.6 | 238.4 | 254.3 | 271.2 | 289.3 | 308.5 |
| Account Receivables, % | 40.1 | 40 | 30.13 | 22.41 | 18.31 | 30.19 | 30.19 | 30.19 | 30.19 | 30.19 |
| Inventories | 58.5 | 103.9 | 88.1 | 55.9 | 28.2 | 80.7 | 86.1 | 91.8 | 98.0 | 104.5 |
| Inventories, % | 10.19 | 16.2 | 13.26 | 7.66 | 3.81 | 10.22 | 10.22 | 10.22 | 10.22 | 10.22 |
| Accounts Payable | 1.8 | 1.3 | .8 | 2.9 | 1.4 | 1.9 | 2.1 | 2.2 | 2.4 | 2.5 |
| Accounts Payable, % | 0.30922 | 0.21006 | 0.1196 | 0.40232 | 0.18701 | 0.24564 | 0.24564 | 0.24564 | 0.24564 | 0.24564 |
| Capital Expenditure | -26.5 | -54.4 | -16.3 | -7.2 | -14.4 | -29.2 | -31.1 | -33.2 | -35.4 | -37.8 |
| Capital Expenditure, % | -4.61 | -8.49 | -2.46 | -0.99239 | -1.94 | -3.7 | -3.7 | -3.7 | -3.7 | -3.7 |
| Tax Rate, % | 8.24 | 8.24 | 8.24 | 8.24 | 8.24 | 8.24 | 8.24 | 8.24 | 8.24 | 8.24 |
| EBITAT | 71.5 | 66.9 | 47.7 | 48.0 | 68.0 | 72.7 | 77.5 | 82.7 | 88.2 | 94.0 |
| Depreciation | ||||||||||
| Changes in Account Receivables | ||||||||||
| Changes in Inventories | ||||||||||
| Changes in Accounts Payable | ||||||||||
| Capital Expenditure | ||||||||||
| UFCF | -225.4 | -32.3 | 138.6 | 143.1 | 137.7 | -78.4 | 60.4 | 64.4 | 68.7 | 73.2 |
| WACC, % | 6.35 | 6.35 | 6.35 | 6.35 | 6.35 | 6.35 | 6.35 | 6.35 | 6.35 | 6.35 |
| PV UFCF | ||||||||||
| SUM PV UFCF | 140.6 | |||||||||
| Long Term Growth Rate, % | 4.00 | |||||||||
| Free cash flow (T + 1) | 76 | |||||||||
| Terminal Value | 3,237 | |||||||||
| Present Terminal Value | 2,379 | |||||||||
| Enterprise Value | 2,520 | |||||||||
| Net Debt | -1,198 | |||||||||
| Equity Value | 3,717 | |||||||||
| Diluted Shares Outstanding, MM | 518 | |||||||||
| Equity Value Per Share | 7.17 |
What You'll Receive
- Adjustable Forecast Inputs: Effortlessly modify assumptions (growth %, margins, WACC) to generate various scenarios.
- Real-Life Data: Shenzhen Forms Syntron Information Co., Ltd.'s (300468SZ) financial information pre-loaded to accelerate your analysis.
- Automated DCF Outputs: This template computes Net Present Value (NPV) and intrinsic value automatically for your convenience.
- Customizable and Professional Design: A sleek Excel model tailored to meet your valuation requirements.
- Designed for Analysts and Investors: Perfect for evaluating projections, confirming strategies, and enhancing efficiency.
Key Features
- Authentic Financial Data: Access comprehensive pre-loaded historical figures and projected financial outcomes for Shenzhen Forms Syntron Information Co., Ltd. (300468SZ).
- Tailorable Forecast Inputs: Modify the highlighted cells for key metrics such as WACC, growth rates, and profit margins.
- Real-Time Calculations: Automatic updates for DCF, Net Present Value (NPV), and cash flow assessments.
- Interactive Dashboard: User-friendly charts and summaries to clearly present your valuation findings.
- Designed for All Levels: An intuitive layout suitable for investors, CFOs, and consultants alike.
How It Works
- Step 1: Download the Excel file for Shenzhen Forms Syntron Information Co., Ltd. (300468SZ).
- Step 2: Review the pre-filled data for the company's historical and projected performance.
- Step 3: Modify key assumptions (highlighted in yellow) based on your analysis.
- Step 4: Observe the automatic recalculations reflecting the intrinsic value of Shenzhen Forms Syntron Information Co., Ltd. (300468SZ).
- Step 5: Utilize the results for your investment decisions or reporting needs.
Why Choose Our Financial Calculator for Shenzhen Forms Syntron Information Co., Ltd. (300468SZ)?
- Designed for Industry Experts: A sophisticated tool utilized by financial analysts, CFOs, and consultants.
- Comprehensive Data: Access to Shenzhen Forms Syntron's historical and projected financials for reliable analysis.
- Versatile Scenario Analysis: Effortlessly test various forecasts and assumptions.
- Intuitive Outputs: Instantly computes intrinsic value, NPV, and essential financial metrics.
- User-Friendly: Detailed step-by-step guidance to navigate through the calculations.
Who Can Benefit from This Product?
- Finance Students: Master valuation methods and practice with real-world data.
- Academics: Integrate industry-standard models into your teaching or research projects.
- Investors: Challenge your hypotheses and evaluate valuation scenarios for Shenzhen Forms Syntron Information Co., Ltd. (300468SZ).
- Analysts: Enhance your efficiency with a ready-to-use, customizable DCF model.
- Small Business Owners: Understand the analytical approaches used for large public companies like Shenzhen Forms Syntron Information Co., Ltd. (300468SZ).
Overview of the Template Components
- Pre-Filled DCF Model: Shenzhen Forms Syntron Information Co., Ltd.'s (300468SZ) financial data preloaded for immediate analysis.
- WACC Calculator: Comprehensive calculations for the Weighted Average Cost of Capital.
- Financial Ratios: Assess the company's profitability, leverage, and operational efficiency.
- Editable Inputs: Modify assumptions such as growth rates, profit margins, and capital expenditures to tailor your scenarios.
- Financial Statements: Access annual and quarterly reports to facilitate in-depth analysis.
- Interactive Dashboard: Effortlessly visualize key valuation metrics and outcomes.
Disclaimer
All information, articles, and product details provided on this website are for general informational and educational purposes only. We do not claim any ownership over, nor do we intend to infringe upon, any trademarks, copyrights, logos, brand names, or other intellectual property mentioned or depicted on this site. Such intellectual property remains the property of its respective owners, and any references here are made solely for identification or informational purposes, without implying any affiliation, endorsement, or partnership.
We make no representations or warranties, express or implied, regarding the accuracy, completeness, or suitability of any content or products presented. Nothing on this website should be construed as legal, tax, investment, financial, medical, or other professional advice. In addition, no part of this site—including articles or product references—constitutes a solicitation, recommendation, endorsement, advertisement, or offer to buy or sell any securities, franchises, or other financial instruments, particularly in jurisdictions where such activity would be unlawful.
All content is of a general nature and may not address the specific circumstances of any individual or entity. It is not a substitute for professional advice or services. Any actions you take based on the information provided here are strictly at your own risk. You accept full responsibility for any decisions or outcomes arising from your use of this website and agree to release us from any liability in connection with your use of, or reliance upon, the content or products found herein.