
|
Changsha Jingjia Microelectronics Co., Ltd. (300474.SZ) Valoración de DCF |
Completamente Editable: Adáptelo A Sus Necesidades En Excel O Sheets
Diseño Profesional: Plantillas Confiables Y Estándares De La Industria
Predeterminadas Para Un Uso Rápido Y Eficiente
Compatible con MAC / PC, completamente desbloqueado
No Se Necesita Experiencia; Fáciles De Seguir
Changsha Jingjia Microelectronics Co., Ltd. (300474.SZ) Bundle
¡Explore el futuro financiero de Changsha Jingjia Microelectronics Co., Ltd. (300474SZ) con nuestra calculadora DCF fácil de usar! Ingrese sus proyecciones para el crecimiento, los márgenes y los costos para determinar el valor intrínseco de Changsha Jingjia Microelectronics Co., Ltd. (300474SZ) y refine su estrategia de inversión.
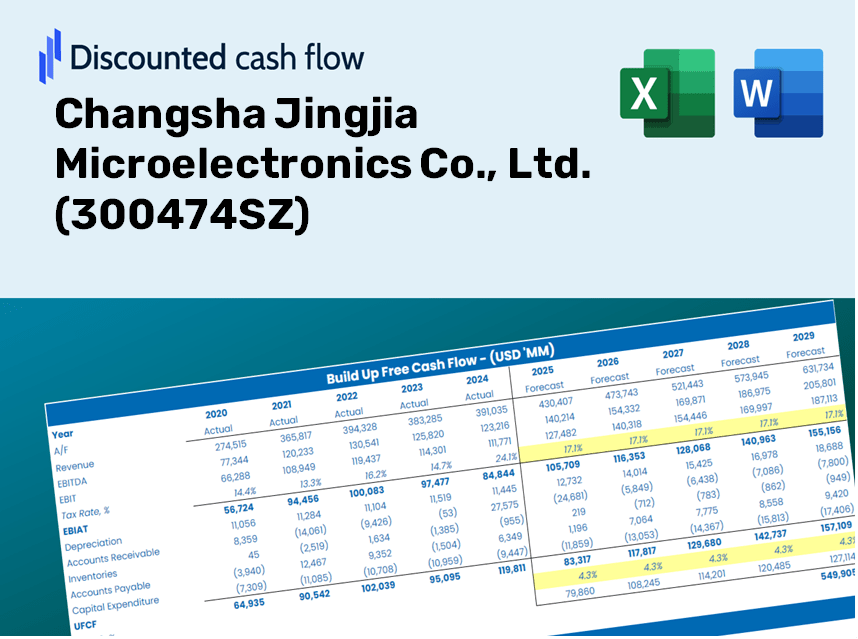
Discounted Cash Flow (DCF) - (USD MM)
| Year | AY1 2020 |
AY2 2021 |
AY3 2022 |
AY4 2023 |
AY5 2024 |
FY1 2025 |
FY2 2026 |
FY3 2027 |
FY4 2028 |
FY5 2029 |
|---|---|---|---|---|---|---|---|---|---|---|
| Revenue | 653.8 | 1,093.2 | 1,153.9 | 713.2 | 466.3 | 466.3 | 466.3 | 466.2 | 466.2 | 466.1 |
| Revenue Growth, % | 0 | 67.21 | 5.56 | -38.19 | -34.62 | -0.00926174 | -0.00926174 | -0.00926174 | -0.00926174 | -0.00926174 |
| EBITDA | 245.9 | 355.7 | 353.3 | 69.2 | -237.1 | 55.6 | 55.6 | 55.6 | 55.6 | 55.6 |
| EBITDA, % | 37.61 | 32.53 | 30.61 | 9.7 | -50.85 | 11.92 | 11.92 | 11.92 | 11.92 | 11.92 |
| Depreciation | 26.0 | 44.7 | 61.0 | 80.8 | 55.1 | 34.0 | 34.0 | 34.0 | 34.0 | 34.0 |
| Depreciation, % | 3.98 | 4.09 | 5.29 | 11.32 | 11.81 | 7.3 | 7.3 | 7.3 | 7.3 | 7.3 |
| EBIT | 219.9 | 311.0 | 292.2 | -11.6 | -292.2 | 21.6 | 21.6 | 21.6 | 21.6 | 21.5 |
| EBIT, % | 33.63 | 28.45 | 25.32 | -1.62 | -62.66 | 4.62 | 4.62 | 4.62 | 4.62 | 4.62 |
| Total Cash | 1,241.4 | 1,160.5 | 846.9 | 1,083.0 | 4,267.7 | 441.5 | 441.4 | 441.4 | 441.4 | 441.3 |
| Total Cash, percent | .0 | .0 | .0 | .0 | .0 | .0 | .0 | .0 | .0 | .0 |
| Account Receivables | 786.9 | 773.3 | 1,285.9 | 1,020.6 | 738.6 | 439.0 | 439.0 | 438.9 | 438.9 | 438.8 |
| Account Receivables, % | 120.36 | 70.74 | 111.44 | 143.09 | 158.37 | 94.15 | 94.15 | 94.15 | 94.15 | 94.15 |
| Inventories | 294.1 | 454.0 | 596.3 | 637.1 | 647.2 | 305.4 | 305.4 | 305.4 | 305.4 | 305.3 |
| Inventories, % | 44.98 | 41.53 | 51.67 | 89.33 | 138.78 | 65.5 | 65.5 | 65.5 | 65.5 | 65.5 |
| Accounts Payable | 83.6 | 205.3 | 279.2 | 344.7 | 101.4 | 117.3 | 117.3 | 117.3 | 117.3 | 117.3 |
| Accounts Payable, % | 12.78 | 18.78 | 24.19 | 48.33 | 21.73 | 25.17 | 25.17 | 25.17 | 25.17 | 25.17 |
| Capital Expenditure | -132.7 | -199.1 | -124.3 | -86.3 | -210.2 | -99.3 | -99.3 | -99.2 | -99.2 | -99.2 |
| Capital Expenditure, % | -20.29 | -18.21 | -10.77 | -12.09 | -45.06 | -21.29 | -21.29 | -21.29 | -21.29 | -21.29 |
| Tax Rate, % | 27.82 | 27.82 | 27.82 | 27.82 | 27.82 | 27.82 | 27.82 | 27.82 | 27.82 | 27.82 |
| EBITAT | 208.7 | 299.7 | 295.2 | 32.9 | -210.9 | 15.7 | 15.7 | 15.7 | 15.7 | 15.7 |
| Depreciation | ||||||||||
| Changes in Account Receivables | ||||||||||
| Changes in Inventories | ||||||||||
| Changes in Accounts Payable | ||||||||||
| Capital Expenditure | ||||||||||
| UFCF | -895.3 | 120.6 | -349.1 | 317.5 | -337.4 | 607.7 | -49.5 | -49.5 | -49.5 | -49.5 |
| WACC, % | 4.75 | 4.75 | 4.76 | 4.74 | 4.75 | 4.75 | 4.75 | 4.75 | 4.75 | 4.75 |
| PV UFCF | ||||||||||
| SUM PV UFCF | 411.7 | |||||||||
| Long Term Growth Rate, % | 4.00 | |||||||||
| Free cash flow (T + 1) | -51 | |||||||||
| Terminal Value | -6,844 | |||||||||
| Present Terminal Value | -5,426 | |||||||||
| Enterprise Value | -5,014 | |||||||||
| Net Debt | -4,092 | |||||||||
| Equity Value | -923 | |||||||||
| Diluted Shares Outstanding, MM | 472 | |||||||||
| Equity Value Per Share | -1.96 |
What You Will Receive
- Comprehensive Financial Model: Leverage Changsha Jingjia Microelectronics Co., Ltd.'s actual data for accurate DCF valuation.
- Complete Forecast Control: Modify revenue growth, profit margins, WACC, and other essential parameters as needed.
- Immediate Calculations: Real-time updates provide instant results with every adjustment you make.
- Professional-Grade Template: A polished Excel file crafted for high-quality valuation suitable for investors.
- Customizable and Reusable: Designed with flexibility in mind, facilitating repeated application for detailed forecasts.
Key Features
- Accurate Financial Data: Access comprehensive pre-loaded historical figures and future forecasts for Changsha Jingjia Microelectronics Co., Ltd. (300474SZ).
- Customizable Forecast Parameters: Modify highlighted fields such as WACC, growth rates, and profit margins to fit your analysis.
- Automated Calculations: Enjoy automatic updates for DCF, Net Present Value (NPV), and cash flow evaluations.
- User-Friendly Dashboard: Clear and informative charts and summaries to help you visualize your valuation insights.
- Designed for All Users: An intuitive layout tailored for investors, CFOs, and consultants, whether you are a professional or just starting out.
How It Functions
- 1. Access the Template: Download and open the Excel file featuring Changsha Jingjia Microelectronics Co., Ltd. (300474SZ)'s preloaded data.
- 2. Adjust Assumptions: Modify key parameters such as growth rates, WACC, and capital expenditures.
- 3. See Results in Real-Time: The DCF model automatically computes intrinsic value and NPV based on your inputs.
- 4. Explore Different Scenarios: Evaluate multiple forecasts to investigate various valuation results.
- 5. Utilize with Assurance: Deliver professional valuation insights to bolster your decision-making process.
Why Opt for This Calculator?
- All-in-One Solution: Combines DCF, WACC, and financial ratio evaluations for comprehensive analysis.
- Flexible Inputs: Modify the yellow-highlighted fields to explore different financial scenarios.
- In-Depth Analysis: Automatically calculates the intrinsic value and Net Present Value for Changsha Jingjia Microelectronics Co., Ltd. (300474SZ).
- Data-Driven: Comes with historical and projected data to provide a solid foundation for analysis.
- Expert-Level Quality: Perfect for financial analysts, investors, and business consultants focused on [Symbol].
Who Can Benefit from This Product?
- Investors: Utilize a professional-grade valuation tool to make informed investment choices in Changsha Jingjia Microelectronics Co., Ltd. (300474SZ).
- Financial Analysts: Streamline your workflow with a customizable pre-built DCF model tailored for (300474SZ).
- Consultants: Efficiently modify the template for presentations or reports focused on Changsha Jingjia Microelectronics Co., Ltd. (300474SZ).
- Finance Enthusiasts: Enhance your knowledge of valuation strategies through practical, real-world examples related to (300474SZ).
- Educators and Students: Leverage this tool as a hands-on resource for finance courses concerning Changsha Jingjia Microelectronics Co., Ltd. (300474SZ).
Contents of the Template
- Pre-Filled Data: Incorporates Changsha Jingjia Microelectronics Co., Ltd.'s historical financial data and projections.
- Discounted Cash Flow Model: A customizable DCF valuation model featuring automatic calculations.
- Weighted Average Cost of Capital (WACC): A dedicated worksheet for computing WACC using user-defined inputs.
- Key Financial Ratios: Evaluate Changsha Jingjia Microelectronics Co., Ltd.'s profitability, efficiency, and financial leverage.
- Customizable Inputs: Easily modify revenue growth, profit margins, and tax rates.
- User-Friendly Dashboard: Visual representations including charts and tables that summarize essential valuation outcomes.
Disclaimer
All information, articles, and product details provided on this website are for general informational and educational purposes only. We do not claim any ownership over, nor do we intend to infringe upon, any trademarks, copyrights, logos, brand names, or other intellectual property mentioned or depicted on this site. Such intellectual property remains the property of its respective owners, and any references here are made solely for identification or informational purposes, without implying any affiliation, endorsement, or partnership.
We make no representations or warranties, express or implied, regarding the accuracy, completeness, or suitability of any content or products presented. Nothing on this website should be construed as legal, tax, investment, financial, medical, or other professional advice. In addition, no part of this site—including articles or product references—constitutes a solicitation, recommendation, endorsement, advertisement, or offer to buy or sell any securities, franchises, or other financial instruments, particularly in jurisdictions where such activity would be unlawful.
All content is of a general nature and may not address the specific circumstances of any individual or entity. It is not a substitute for professional advice or services. Any actions you take based on the information provided here are strictly at your own risk. You accept full responsibility for any decisions or outcomes arising from your use of this website and agree to release us from any liability in connection with your use of, or reliance upon, the content or products found herein.