
|
Victory Giant Technology Co., Ltd. (300476.sz) Valoración de DCF |
Completamente Editable: Adáptelo A Sus Necesidades En Excel O Sheets
Diseño Profesional: Plantillas Confiables Y Estándares De La Industria
Predeterminadas Para Un Uso Rápido Y Eficiente
Compatible con MAC / PC, completamente desbloqueado
No Se Necesita Experiencia; Fáciles De Seguir
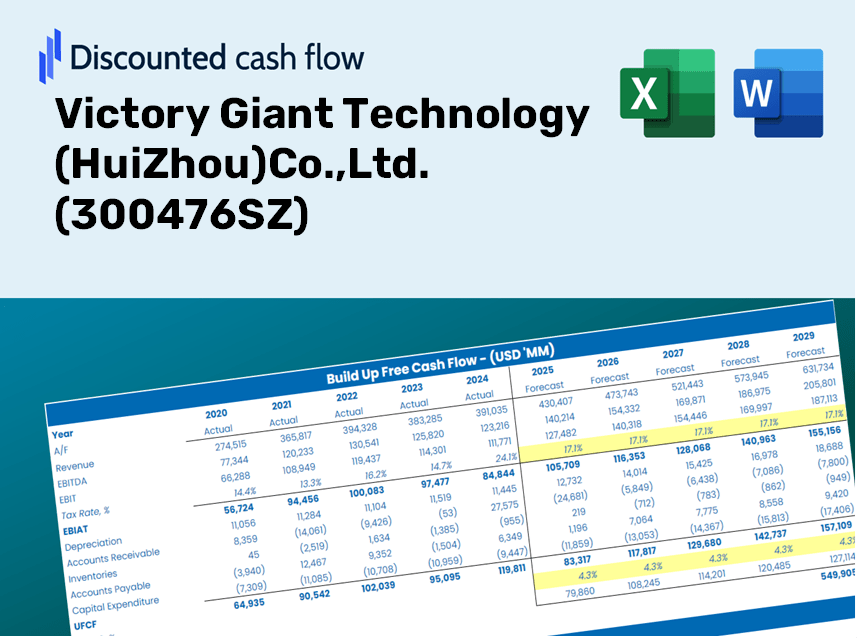
Victory Giant Technology (HuiZhou)Co.,Ltd. (300476.SZ) Bundle
¡Simplifique la valoración de la tecnología gigante de la victoria (Huizhou) Co., Ltd. (300476SZ) con esta calculadora DCF personalizable! Con Real Victory Giant Technology (Huizhou) Co., Ltd. (300476SZ) Financials y aportes de pronóstico ajustable, puede probar escenarios y descubrir la tecnología gigante de la victoria (Huizhou) Co., Ltd. (300476SZ) valor razonable en minutos.
Discounted Cash Flow (DCF) - (USD MM)
| Year | AY1 2020 |
AY2 2021 |
AY3 2022 |
AY4 2023 |
AY5 2024 |
FY1 2025 |
FY2 2026 |
FY3 2027 |
FY4 2028 |
FY5 2029 |
|---|---|---|---|---|---|---|---|---|---|---|
| Revenue | 5,599.6 | 7,432.0 | 7,885.2 | 7,931.2 | 10,731.5 | 12,735.9 | 15,114.7 | 17,937.8 | 21,288.2 | 25,264.4 |
| Revenue Growth, % | 0 | 32.72 | 6.1 | 0.58455 | 35.31 | 18.68 | 18.68 | 18.68 | 18.68 | 18.68 |
| EBITDA | 986.4 | 1,280.5 | 1,585.3 | 1,472.5 | 2,176.8 | 2,389.2 | 2,835.5 | 3,365.1 | 3,993.6 | 4,739.5 |
| EBITDA, % | 17.61 | 17.23 | 20.1 | 18.57 | 20.28 | 18.76 | 18.76 | 18.76 | 18.76 | 18.76 |
| Depreciation | 333.3 | 447.8 | 609.2 | 637.9 | 754.5 | 885.9 | 1,051.3 | 1,247.7 | 1,480.7 | 1,757.3 |
| Depreciation, % | 5.95 | 6.03 | 7.73 | 8.04 | 7.03 | 6.96 | 6.96 | 6.96 | 6.96 | 6.96 |
| EBIT | 653.0 | 832.7 | 976.2 | 834.5 | 1,422.3 | 1,503.4 | 1,784.2 | 2,117.4 | 2,512.9 | 2,982.2 |
| EBIT, % | 11.66 | 11.2 | 12.38 | 10.52 | 13.25 | 11.8 | 11.8 | 11.8 | 11.8 | 11.8 |
| Total Cash | 472.8 | 1,030.3 | 1,597.6 | 2,144.8 | 1,662.0 | 2,167.6 | 2,572.4 | 3,052.9 | 3,623.1 | 4,299.9 |
| Total Cash, percent | .0 | .0 | .0 | .0 | .0 | .0 | .0 | .0 | .0 | .0 |
| Account Receivables | 2,623.0 | 3,223.0 | 3,075.9 | .0 | 4,237.4 | 4,297.1 | 5,099.8 | 6,052.3 | 7,182.7 | 8,524.3 |
| Account Receivables, % | 46.84 | 43.37 | 39.01 | 0 | 39.49 | 33.74 | 33.74 | 33.74 | 33.74 | 33.74 |
| Inventories | 828.5 | 1,514.9 | 1,124.5 | 1,376.8 | 2,045.4 | 2,187.0 | 2,595.5 | 3,080.3 | 3,655.6 | 4,338.4 |
| Inventories, % | 14.8 | 20.38 | 14.26 | 17.36 | 19.06 | 17.17 | 17.17 | 17.17 | 17.17 | 17.17 |
| Accounts Payable | 3,438.5 | 4,247.6 | 3,409.9 | 3,605.3 | 4,963.0 | 6,457.3 | 7,663.4 | 9,094.7 | 10,793.4 | 12,809.4 |
| Accounts Payable, % | 61.41 | 57.15 | 43.24 | 45.46 | 46.25 | 50.7 | 50.7 | 50.7 | 50.7 | 50.7 |
| Capital Expenditure | -2,101.7 | -1,537.5 | -1,060.6 | -644.6 | -833.8 | -2,230.5 | -2,647.1 | -3,141.5 | -3,728.3 | -4,424.7 |
| Capital Expenditure, % | -37.53 | -20.69 | -13.45 | -8.13 | -7.77 | -17.51 | -17.51 | -17.51 | -17.51 | -17.51 |
| Tax Rate, % | 12 | 12 | 12 | 12 | 12 | 12 | 12 | 12 | 12 | 12 |
| EBITAT | 572.7 | 757.4 | 860.2 | 747.8 | 1,251.6 | 1,336.2 | 1,585.7 | 1,881.9 | 2,233.4 | 2,650.6 |
| Depreciation | ||||||||||
| Changes in Account Receivables | ||||||||||
| Changes in Inventories | ||||||||||
| Changes in Accounts Payable | ||||||||||
| Capital Expenditure | ||||||||||
| UFCF | -1,208.6 | -809.5 | 108.5 | 3,760.2 | -2,375.9 | 1,284.4 | -15.1 | -17.9 | -21.2 | -25.2 |
| WACC, % | 6.01 | 6.01 | 6.01 | 6.01 | 6.01 | 6.01 | 6.01 | 6.01 | 6.01 | 6.01 |
| PV UFCF | ||||||||||
| SUM PV UFCF | 1,147.5 | |||||||||
| Long Term Growth Rate, % | 4.00 | |||||||||
| Free cash flow (T + 1) | -26 | |||||||||
| Terminal Value | -1,304 | |||||||||
| Present Terminal Value | -974 | |||||||||
| Enterprise Value | 173 | |||||||||
| Net Debt | 1,962 | |||||||||
| Equity Value | -1,788 | |||||||||
| Diluted Shares Outstanding, MM | 862 | |||||||||
| Equity Value Per Share | -2.08 |
What You Will Receive
- Authentic 300476SZ Financial Data: Pre-populated with Victory Giant Technology's historical and projected figures for accurate analysis.
- Completely Customizable Template: Easily adjust key variables such as revenue growth, WACC, and EBITDA percentage.
- Instant Calculations: Watch the intrinsic value of 300476SZ update in real-time as you modify inputs.
- Professional Valuation Tool: Crafted for investors, analysts, and consultants aiming for precise DCF outcomes.
- User-Friendly Interface: Intuitive layout and straightforward instructions suitable for all levels of expertise.
Key Features
- Real-Time VGT Data: Pre-populated with Victory Giant Technology’s historical performance and future projections.
- Customizable Parameters: Modify factors such as revenue growth, profit margins, discount rates, tax obligations, and capital investments.
- Adaptive Valuation Framework: Automatically refreshes Net Present Value (NPV) and intrinsic value in response to your adjustments.
- Scenario Analysis: Develop various forecasting scenarios to explore different valuation possibilities.
- Intuitive Interface: Designed for ease of use, catering to both professionals and newcomers in the field.
How It Operates
- 1. Access the Template: Download and open the Excel sheet featuring Victory Giant Technology’s preloaded data.
- 2. Update Key Assumptions: Modify crucial inputs such as growth forecasts, WACC, and capital expenditures.
- 3. Analyze Results in Real-Time: The DCF model automatically computes intrinsic value and NPV.
- 4. Explore Various Scenarios: Evaluate multiple projections to assess different valuation outcomes.
- 5. Present with Assurance: Deliver professional valuation insights to enhance your strategic decisions.
Why Opt for Victory Giant Technology ([300476SZ]) Calculator?
- Reliable Data: Utilize genuine financial information from Victory Giant Technology for trustworthy valuation outcomes.
- Flexible Options: Tailor essential parameters like growth projections, WACC, and tax rates to align with your forecasts.
- Efficient: Ready-to-use calculations save you the hassle of starting anew.
- Professional-Quality Tool: Crafted for investors, analysts, and consultants alike.
- Easy to Use: User-friendly design and clear, step-by-step guidance make it accessible for everyone.
Who Can Benefit from Our Products?
- Investors: Gain clarity in your investment choices with our advanced technology solutions.
- Financial Analysts: Enhance your efficiency using our customizable financial modeling tools.
- Consultants: Easily tailor our resources for impactful client presentations and reports.
- Tech Enthusiasts: Expand your knowledge of technology innovations with real-life case studies.
- Educators and Students: Utilize our tools as hands-on learning aids in technology and finance courses.
Contents of the Template
- Historical Data: Comprehensive overview of Victory Giant Technology’s previous financial performance and foundational forecasts.
- DCF and Levered DCF Models: In-depth templates to assess the intrinsic value of Victory Giant Technology (300476SZ).
- WACC Sheet: Ready-to-use calculations for the Weighted Average Cost of Capital.
- Editable Inputs: Customize essential drivers such as growth rates, EBITDA percentages, and CAPEX assumptions.
- Quarterly and Annual Statements: An extensive analysis of Victory Giant Technology’s financial data.
- Interactive Dashboard: Dynamically visualize valuation outcomes and projections.
Disclaimer
All information, articles, and product details provided on this website are for general informational and educational purposes only. We do not claim any ownership over, nor do we intend to infringe upon, any trademarks, copyrights, logos, brand names, or other intellectual property mentioned or depicted on this site. Such intellectual property remains the property of its respective owners, and any references here are made solely for identification or informational purposes, without implying any affiliation, endorsement, or partnership.
We make no representations or warranties, express or implied, regarding the accuracy, completeness, or suitability of any content or products presented. Nothing on this website should be construed as legal, tax, investment, financial, medical, or other professional advice. In addition, no part of this site—including articles or product references—constitutes a solicitation, recommendation, endorsement, advertisement, or offer to buy or sell any securities, franchises, or other financial instruments, particularly in jurisdictions where such activity would be unlawful.
All content is of a general nature and may not address the specific circumstances of any individual or entity. It is not a substitute for professional advice or services. Any actions you take based on the information provided here are strictly at your own risk. You accept full responsibility for any decisions or outcomes arising from your use of this website and agree to release us from any liability in connection with your use of, or reliance upon, the content or products found herein.