
|
Guangzhou Wondfo Biotech Co., Ltd (300482.sz) Valoración de DCF |
Completamente Editable: Adáptelo A Sus Necesidades En Excel O Sheets
Diseño Profesional: Plantillas Confiables Y Estándares De La Industria
Predeterminadas Para Un Uso Rápido Y Eficiente
Compatible con MAC / PC, completamente desbloqueado
No Se Necesita Experiencia; Fáciles De Seguir
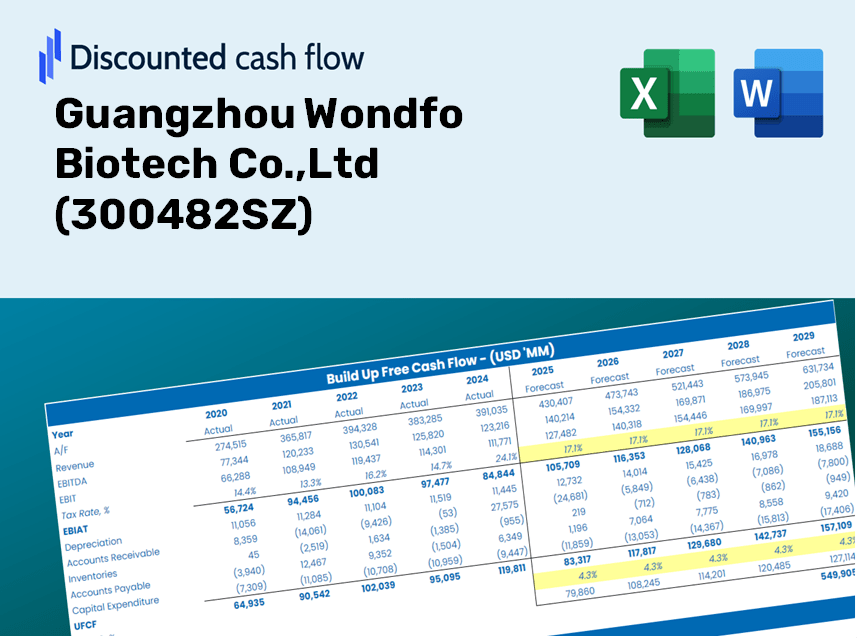
Guangzhou Wondfo Biotech Co.,Ltd (300482.SZ) Bundle
Diseñada para la precisión, nuestra calculadora DCF (300482SZ) le permite evaluar la valoración de Guangzhou Wondfo Biotech Co., Ltd utilizando datos financieros del mundo real, que ofrece una flexibilidad completa para modificar todos los parámetros esenciales para las proyecciones mejoradas.
Discounted Cash Flow (DCF) - (USD MM)
| Year | AY1 2020 |
AY2 2021 |
AY3 2022 |
AY4 2023 |
AY5 2024 |
FY1 2025 |
FY2 2026 |
FY3 2027 |
FY4 2028 |
FY5 2029 |
|---|---|---|---|---|---|---|---|---|---|---|
| Revenue | 2,810.8 | 3,361.0 | 5,680.5 | 2,764.9 | 3,064.8 | 3,145.8 | 3,229.0 | 3,314.3 | 3,401.9 | 3,491.8 |
| Revenue Growth, % | 0 | 19.57 | 69.01 | -51.33 | 10.85 | 2.64 | 2.64 | 2.64 | 2.64 | 2.64 |
| EBITDA | 890.7 | 921.2 | 1,673.5 | 859.1 | 932.2 | 944.0 | 969.0 | 994.6 | 1,020.9 | 1,047.9 |
| EBITDA, % | 31.69 | 27.41 | 29.46 | 31.07 | 30.42 | 30.01 | 30.01 | 30.01 | 30.01 | 30.01 |
| Depreciation | 145.4 | 210.7 | 277.2 | 281.8 | 272.3 | 222.7 | 228.6 | 234.7 | 240.9 | 247.2 |
| Depreciation, % | 5.17 | 6.27 | 4.88 | 10.19 | 8.88 | 7.08 | 7.08 | 7.08 | 7.08 | 7.08 |
| EBIT | 745.3 | 710.5 | 1,396.3 | 577.3 | 659.9 | 721.3 | 740.4 | 760.0 | 780.0 | 800.7 |
| EBIT, % | 26.51 | 21.14 | 24.58 | 20.88 | 21.53 | 22.93 | 22.93 | 22.93 | 22.93 | 22.93 |
| Total Cash | 1,510.9 | 1,568.9 | 2,100.6 | 1,562.7 | 2,135.0 | 1,658.4 | 1,702.3 | 1,747.2 | 1,793.4 | 1,840.8 |
| Total Cash, percent | .0 | .0 | .0 | .0 | .0 | .0 | .0 | .0 | .0 | .0 |
| Account Receivables | 345.2 | 566.5 | 607.6 | 651.6 | 1,174.3 | 640.0 | 656.9 | 674.2 | 692.0 | 710.3 |
| Account Receivables, % | 12.28 | 16.85 | 10.7 | 23.57 | 38.32 | 20.34 | 20.34 | 20.34 | 20.34 | 20.34 |
| Inventories | 376.7 | 386.2 | 400.0 | 351.4 | 359.6 | 354.7 | 364.1 | 373.7 | 383.6 | 393.7 |
| Inventories, % | 13.4 | 11.49 | 7.04 | 12.71 | 11.73 | 11.27 | 11.27 | 11.27 | 11.27 | 11.27 |
| Accounts Payable | 299.5 | 400.0 | 320.1 | 130.5 | 288.4 | 266.2 | 273.3 | 280.5 | 287.9 | 295.5 |
| Accounts Payable, % | 10.66 | 11.9 | 5.63 | 4.72 | 9.41 | 8.46 | 8.46 | 8.46 | 8.46 | 8.46 |
| Capital Expenditure | -419.5 | -456.5 | -583.2 | -432.7 | -318.2 | -407.7 | -418.5 | -429.6 | -440.9 | -452.6 |
| Capital Expenditure, % | -14.92 | -13.58 | -10.27 | -15.65 | -10.38 | -12.96 | -12.96 | -12.96 | -12.96 | -12.96 |
| Tax Rate, % | 10.78 | 10.78 | 10.78 | 10.78 | 10.78 | 10.78 | 10.78 | 10.78 | 10.78 | 10.78 |
| EBITAT | 646.6 | 662.5 | 1,225.0 | 520.6 | 588.8 | 645.0 | 662.1 | 679.6 | 697.5 | 716.0 |
| Depreciation | ||||||||||
| Changes in Account Receivables | ||||||||||
| Changes in Inventories | ||||||||||
| Changes in Accounts Payable | ||||||||||
| Capital Expenditure | ||||||||||
| UFCF | -49.9 | 286.3 | 784.2 | 184.6 | 169.9 | 977.1 | 452.9 | 464.9 | 477.2 | 489.8 |
| WACC, % | 8.79 | 8.81 | 8.79 | 8.8 | 8.8 | 8.8 | 8.8 | 8.8 | 8.8 | 8.8 |
| PV UFCF | ||||||||||
| SUM PV UFCF | 2,303.7 | |||||||||
| Long Term Growth Rate, % | 2.00 | |||||||||
| Free cash flow (T + 1) | 500 | |||||||||
| Terminal Value | 7,351 | |||||||||
| Present Terminal Value | 4,823 | |||||||||
| Enterprise Value | 7,127 | |||||||||
| Net Debt | -243 | |||||||||
| Equity Value | 7,369 | |||||||||
| Diluted Shares Outstanding, MM | 464 | |||||||||
| Equity Value Per Share | 15.88 |
What You Will Receive
- Genuine Wondfo Financial Data: Pre-loaded with Guangzhou Wondfo Biotech Co., Ltd’s historical and forecasted data for accurate analysis.
- Completely Customizable Template: Easily adjust key inputs such as revenue growth, WACC, and EBITDA percentages.
- Instant Calculations: Watch the intrinsic value of Wondfo update immediately as you make changes.
- Expert Valuation Tool: Tailored for investors, analysts, and consultants in need of precise DCF evaluations.
- Intuitive Design: Clear layout and straightforward instructions suitable for users of all skill levels.
Key Features
- Comprehensive DCF Calculator: Offers detailed unlevered and levered DCF valuation models tailored for Guangzhou Wondfo Biotech Co., Ltd (300482SZ).
- WACC Calculator: Features a pre-configured Weighted Average Cost of Capital sheet with fully customizable inputs.
- Editable Forecast Assumptions: Adjust growth rates, capital expenditures, and discount rates as needed.
- Integrated Financial Ratios: Evaluate profitability, leverage, and efficiency ratios specific to Guangzhou Wondfo Biotech Co., Ltd (300482SZ).
- Interactive Dashboard and Charts: Visual displays provide a summary of key valuation metrics for straightforward analysis.
How It Works
- Step 1: Download the prebuilt Excel template featuring data for Guangzhou Wondfo Biotech Co., Ltd (300482SZ).
- Step 2: Navigate through the pre-filled sheets to familiarize yourself with the essential metrics.
- Step 3: Modify projections and assumptions in the editable yellow cells (WACC, growth rates, margins).
- Step 4: Instantly see the updated results, including the intrinsic value of Guangzhou Wondfo Biotech Co., Ltd (300482SZ).
- Step 5: Utilize the outputs to make well-informed investment decisions or to create comprehensive reports.
Why Choose Guangzhou Wondfo Biotech Co., Ltd (300482SZ)?
- Precision: Utilizes authentic financial data to ensure reliable results.
- Adaptability: Built to allow users to easily adjust and evaluate various inputs.
- Efficiency: Eliminate the need to create complex financial models from the ground up.
- Expert-Quality: Crafted with the expertise and insight required by industry professionals.
- Accessible: Intuitive design makes it suitable for users of all skill levels, including those new to financial modeling.
Who Can Benefit from This Product?
- Investors: Accurately assess the fair value of Guangzhou Wondfo Biotech Co., Ltd (300482SZ) before making investment decisions.
- CFOs: Utilize a professional-grade DCF model for comprehensive financial reporting and analysis.
- Consultants: Efficiently customize the template for client valuation reports.
- Entrepreneurs: Acquire valuable insights into financial modeling practices employed by leading biotech firms.
- Educators: Employ it as a teaching resource to illustrate various valuation methodologies.
Contents of the Template
- Comprehensive DCF Model: Editable framework featuring detailed valuation calculations.
- Real-World Data: Historical and projected financials of Guangzhou Wondfo Biotech Co., Ltd (300482SZ) preloaded for insightful analysis.
- Customizable Parameters: Modify WACC, growth rates, and tax assumptions to explore various scenarios.
- Financial Statements: Complete annual and quarterly breakdowns for enhanced insights.
- Key Ratios: Integrated analysis for assessing profitability, efficiency, and leverage.
- Dashboard with Visual Outputs: Charts and tables delivering clear, actionable results.
Disclaimer
All information, articles, and product details provided on this website are for general informational and educational purposes only. We do not claim any ownership over, nor do we intend to infringe upon, any trademarks, copyrights, logos, brand names, or other intellectual property mentioned or depicted on this site. Such intellectual property remains the property of its respective owners, and any references here are made solely for identification or informational purposes, without implying any affiliation, endorsement, or partnership.
We make no representations or warranties, express or implied, regarding the accuracy, completeness, or suitability of any content or products presented. Nothing on this website should be construed as legal, tax, investment, financial, medical, or other professional advice. In addition, no part of this site—including articles or product references—constitutes a solicitation, recommendation, endorsement, advertisement, or offer to buy or sell any securities, franchises, or other financial instruments, particularly in jurisdictions where such activity would be unlawful.
All content is of a general nature and may not address the specific circumstances of any individual or entity. It is not a substitute for professional advice or services. Any actions you take based on the information provided here are strictly at your own risk. You accept full responsibility for any decisions or outcomes arising from your use of this website and agree to release us from any liability in connection with your use of, or reliance upon, the content or products found herein.