
|
Eoptolink Technology Inc., Ltd. (300502.SZ) Valoración de DCF |
Completamente Editable: Adáptelo A Sus Necesidades En Excel O Sheets
Diseño Profesional: Plantillas Confiables Y Estándares De La Industria
Predeterminadas Para Un Uso Rápido Y Eficiente
Compatible con MAC / PC, completamente desbloqueado
No Se Necesita Experiencia; Fáciles De Seguir
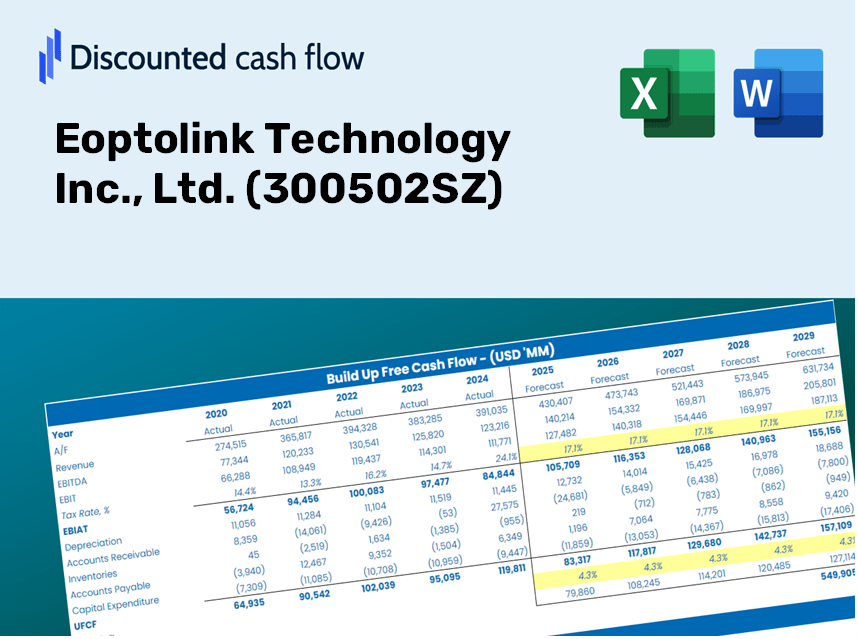
Eoptolink Technology Inc., Ltd. (300502.SZ) Bundle
Diseñada para la precisión, nuestra calculadora DCF (300502SZ) le permite evaluar Eoptolink Technology Inc., Ltd. Valoración utilizando datos financieros del mundo real, ofreciendo una flexibilidad completa para modificar todos los parámetros clave para las proyecciones mejoradas.
Discounted Cash Flow (DCF) - (USD MM)
| Year | AY1 2020 |
AY2 2021 |
AY3 2022 |
AY4 2023 |
AY5 2024 |
FY1 2025 |
FY2 2026 |
FY3 2027 |
FY4 2028 |
FY5 2029 |
|---|---|---|---|---|---|---|---|---|---|---|
| Revenue | 1,997.9 | 2,908.4 | 3,310.6 | 3,097.6 | 8,646.8 | 11,953.5 | 16,524.6 | 22,843.9 | 31,579.6 | 43,656.1 |
| Revenue Growth, % | 0 | 45.57 | 13.83 | -6.43 | 179.15 | 38.24 | 38.24 | 38.24 | 38.24 | 38.24 |
| EBITDA | 581.8 | 755.5 | 881.4 | 807.8 | 3,229.4 | 3,470.0 | 4,796.9 | 6,631.3 | 9,167.2 | 12,672.9 |
| EBITDA, % | 29.12 | 25.98 | 26.62 | 26.08 | 37.35 | 29.03 | 29.03 | 29.03 | 29.03 | 29.03 |
| Depreciation | 50.0 | 72.2 | 97.0 | 129.5 | 184.2 | 340.1 | 470.2 | 650.0 | 898.6 | 1,242.2 |
| Depreciation, % | 2.5 | 2.48 | 2.93 | 4.18 | 2.13 | 2.85 | 2.85 | 2.85 | 2.85 | 2.85 |
| EBIT | 531.8 | 683.2 | 784.4 | 678.3 | 3,045.2 | 3,129.8 | 4,326.7 | 5,981.3 | 8,268.6 | 11,430.7 |
| EBIT, % | 26.62 | 23.49 | 23.69 | 21.9 | 35.22 | 26.18 | 26.18 | 26.18 | 26.18 | 26.18 |
| Total Cash | 1,931.4 | 1,579.8 | 1,785.0 | 2,515.3 | 1,600.3 | 7,282.4 | 10,067.3 | 13,917.1 | 19,239.2 | 26,596.5 |
| Total Cash, percent | .0 | .0 | .0 | .0 | .0 | .0 | .0 | .0 | .0 | .0 |
| Account Receivables | 518.2 | 712.6 | 745.8 | 753.1 | 2,567.8 | 3,035.5 | 4,196.3 | 5,801.0 | 8,019.4 | 11,086.2 |
| Account Receivables, % | 25.94 | 24.5 | 22.53 | 24.31 | 29.7 | 25.39 | 25.39 | 25.39 | 25.39 | 25.39 |
| Inventories | 971.8 | 1,526.2 | 1,469.2 | 963.3 | 4,132.1 | 5,364.3 | 7,415.6 | 10,251.5 | 14,171.7 | 19,591.2 |
| Inventories, % | 48.64 | 52.48 | 44.38 | 31.1 | 47.79 | 44.88 | 44.88 | 44.88 | 44.88 | 44.88 |
| Accounts Payable | 461.8 | 752.3 | 605.2 | 632.6 | 1,627.6 | 2,546.2 | 3,519.9 | 4,865.9 | 6,726.7 | 9,299.1 |
| Accounts Payable, % | 23.11 | 25.87 | 18.28 | 20.42 | 18.82 | 21.3 | 21.3 | 21.3 | 21.3 | 21.3 |
| Capital Expenditure | -290.6 | -273.5 | -364.7 | -554.3 | -1,476.3 | -1,672.0 | -2,311.3 | -3,195.2 | -4,417.1 | -6,106.3 |
| Capital Expenditure, % | -14.55 | -9.4 | -11.02 | -17.89 | -17.07 | -13.99 | -13.99 | -13.99 | -13.99 | -13.99 |
| Tax Rate, % | 12.26 | 12.26 | 12.26 | 12.26 | 12.26 | 12.26 | 12.26 | 12.26 | 12.26 | 12.26 |
| EBITAT | 465.7 | 592.6 | 689.6 | 592.0 | 2,672.0 | 2,737.0 | 3,783.6 | 5,230.5 | 7,230.7 | 9,995.8 |
| Depreciation | ||||||||||
| Changes in Account Receivables | ||||||||||
| Changes in Inventories | ||||||||||
| Changes in Accounts Payable | ||||||||||
| Capital Expenditure | ||||||||||
| UFCF | -803.2 | -66.9 | 298.5 | 693.1 | -2,608.5 | 623.8 | -296.0 | -409.2 | -565.7 | -782.1 |
| WACC, % | 8.42 | 8.42 | 8.42 | 8.42 | 8.42 | 8.42 | 8.42 | 8.42 | 8.42 | 8.42 |
| PV UFCF | ||||||||||
| SUM PV UFCF | -929.2 | |||||||||
| Long Term Growth Rate, % | 4.00 | |||||||||
| Free cash flow (T + 1) | -813 | |||||||||
| Terminal Value | -18,417 | |||||||||
| Present Terminal Value | -12,295 | |||||||||
| Enterprise Value | -13,225 | |||||||||
| Net Debt | -1,586 | |||||||||
| Equity Value | -11,639 | |||||||||
| Diluted Shares Outstanding, MM | 994 | |||||||||
| Equity Value Per Share | -11.70 |
What You Will Receive
- Modifiable Forecast Inputs: Effortlessly adjust assumptions (growth %, margins, WACC) to explore various scenarios.
- Real-World Data: Eoptolink Technology Inc.'s financial data pre-populated to facilitate your analysis.
- Automated DCF Outputs: The template calculates Net Present Value (NPV) and intrinsic value automatically.
- Customizable and Professional: A sleek Excel model tailored to fit your valuation requirements.
- Designed for Analysts and Investors: Perfect for assessing projections, validating strategies, and enhancing efficiency.
Key Features
- Comprehensive DCF Calculator: Features detailed unlevered and levered DCF valuation frameworks.
- WACC Calculator: Ready-to-use Weighted Average Cost of Capital model with adjustable parameters.
- Customizable Forecast Assumptions: Easily adjust growth rates, capital investments, and discount rates.
- Integrated Financial Ratios: Assess profitability, leverage, and efficiency ratios for Eoptolink Technology Inc. (300502SZ).
- Visual Dashboard and Graphs: Graphical representations highlight essential valuation metrics for straightforward analysis.
How It Works
- Download: Obtain the pre-formatted Excel file containing Eoptolink Technology Inc.'s (300502SZ) financial data.
- Customize: Modify forecasts, including revenue growth, EBITDA percentage, and WACC values.
- Update Automatically: The intrinsic value and NPV calculations refresh in real-time.
- Test Scenarios: Generate various projections and instantly compare their outcomes.
- Make Decisions: Leverage the valuation findings to inform your investment approach.
Why Choose This Calculator for Eoptolink Technology Inc. (300502SZ)?
- Designed for Experts: An advanced tool tailored for analysts, CFOs, and consultants.
- Up-to-Date Data: Eoptolink's historical and projected financials are preloaded for precision.
- Flexible Scenario Analysis: Effortlessly simulate various forecasts and assumptions.
- Comprehensive Outputs: Quickly calculates intrinsic value, NPV, and essential metrics.
- User-Friendly: Clear, step-by-step instructions help you navigate the tool with ease.
Who Should Use This Product?
- Investors: Evaluate Eoptolink’s valuation prior to making stock transactions.
- CFOs and Financial Analysts: Enhance valuation workflows and assess financial forecasts.
- Startup Founders: Discover how established companies like Eoptolink are valued in the market.
- Consultants: Provide comprehensive valuation reports for your clients.
- Students and Educators: Utilize current data to practice and teach valuation methodologies.
Contents of the Template
- Operating and Balance Sheet Data: Pre-filled historical data and forecasts for Eoptolink Technology Inc., Ltd. (300502SZ), including revenue, EBITDA, EBIT, and capital expenditures.
- WACC Calculation: A dedicated sheet for calculating the Weighted Average Cost of Capital (WACC), featuring parameters such as Beta, risk-free rate, and share price.
- DCF Valuation (Unlevered and Levered): Customizable Discounted Cash Flow models that present intrinsic value with comprehensive calculations.
- Financial Statements: Pre-loaded annual and quarterly financial statements to facilitate detailed analysis.
- Key Ratios: Includes profitability, leverage, and efficiency ratios for Eoptolink Technology Inc., Ltd. (300502SZ).
- Dashboard and Charts: Visual overview of valuation outputs and assumptions for simplified result analysis.
Disclaimer
All information, articles, and product details provided on this website are for general informational and educational purposes only. We do not claim any ownership over, nor do we intend to infringe upon, any trademarks, copyrights, logos, brand names, or other intellectual property mentioned or depicted on this site. Such intellectual property remains the property of its respective owners, and any references here are made solely for identification or informational purposes, without implying any affiliation, endorsement, or partnership.
We make no representations or warranties, express or implied, regarding the accuracy, completeness, or suitability of any content or products presented. Nothing on this website should be construed as legal, tax, investment, financial, medical, or other professional advice. In addition, no part of this site—including articles or product references—constitutes a solicitation, recommendation, endorsement, advertisement, or offer to buy or sell any securities, franchises, or other financial instruments, particularly in jurisdictions where such activity would be unlawful.
All content is of a general nature and may not address the specific circumstances of any individual or entity. It is not a substitute for professional advice or services. Any actions you take based on the information provided here are strictly at your own risk. You accept full responsibility for any decisions or outcomes arising from your use of this website and agree to release us from any liability in connection with your use of, or reliance upon, the content or products found herein.