
|
Vanjee Technology Co., Ltd. (300552.SZ) DCF Valoración |
Completamente Editable: Adáptelo A Sus Necesidades En Excel O Sheets
Diseño Profesional: Plantillas Confiables Y Estándares De La Industria
Predeterminadas Para Un Uso Rápido Y Eficiente
Compatible con MAC / PC, completamente desbloqueado
No Se Necesita Experiencia; Fáciles De Seguir
Vanjee Technology Co., Ltd. (300552.SZ) Bundle
Ya sea que sea un inversor o analista, esta calculadora DCF (300552SZ) es su herramienta de referencia para una valoración precisa. Equipado con datos reales de Vanjee Technology Co., Ltd., puede ajustar los pronósticos e inmediatamente observar los efectos.
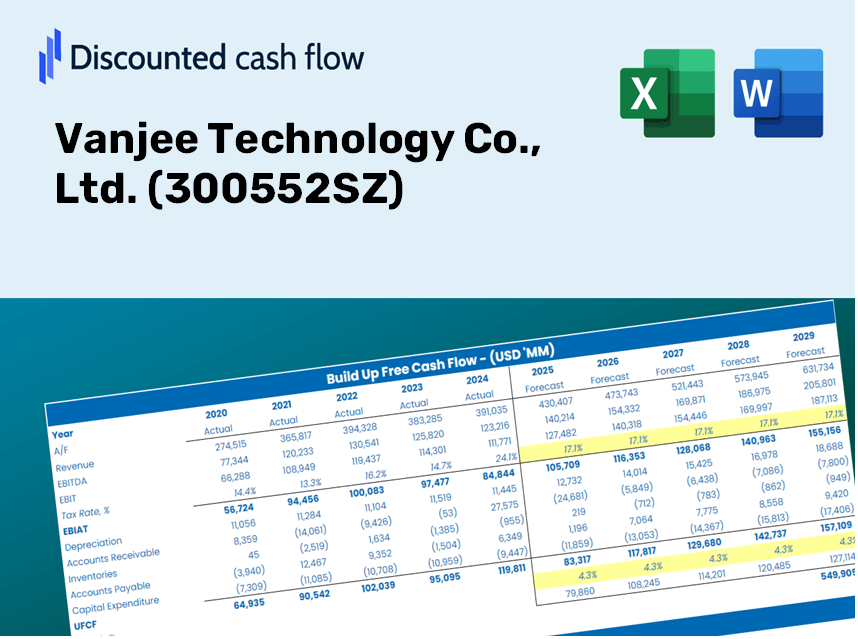
Discounted Cash Flow (DCF) - (USD MM)
| Year | AY1 2020 |
AY2 2021 |
AY3 2022 |
AY4 2023 |
AY5 2024 |
FY1 2025 |
FY2 2026 |
FY3 2027 |
FY4 2028 |
FY5 2029 |
|---|---|---|---|---|---|---|---|---|---|---|
| Revenue | 1,662.6 | 944.9 | 873.1 | 909.0 | 930.2 | 827.1 | 735.5 | 654.0 | 581.5 | 517.1 |
| Revenue Growth, % | 0 | -43.17 | -7.6 | 4.11 | 2.33 | -11.08 | -11.08 | -11.08 | -11.08 | -11.08 |
| EBITDA | 711.9 | 67.7 | -4.0 | -347.6 | -318.6 | -38.0 | -33.8 | -30.0 | -26.7 | -23.7 |
| EBITDA, % | 42.82 | 7.17 | -0.45688 | -38.24 | -34.25 | -4.59 | -4.59 | -4.59 | -4.59 | -4.59 |
| Depreciation | 21.1 | 42.9 | 45.7 | 55.2 | 62.6 | 39.4 | 35.1 | 31.2 | 27.7 | 24.7 |
| Depreciation, % | 1.27 | 4.54 | 5.23 | 6.07 | 6.73 | 4.77 | 4.77 | 4.77 | 4.77 | 4.77 |
| EBIT | 690.8 | 24.8 | -49.7 | -402.8 | -381.2 | -77.4 | -68.8 | -61.2 | -54.4 | -48.4 |
| EBIT, % | 41.55 | 2.63 | -5.69 | -44.31 | -40.98 | -9.36 | -9.36 | -9.36 | -9.36 | -9.36 |
| Total Cash | 671.9 | 1,114.6 | 799.8 | 537.3 | 371.0 | 547.6 | 486.9 | 433.0 | 385.0 | 342.3 |
| Total Cash, percent | .0 | .0 | .0 | .0 | .0 | .0 | .0 | .0 | .0 | .0 |
| Account Receivables | 1,319.2 | 1,052.4 | 1,059.7 | 1,152.9 | 1,032.7 | 793.0 | 705.1 | 627.0 | 557.5 | 495.7 |
| Account Receivables, % | 79.35 | 111.38 | 121.38 | 126.84 | 111.01 | 95.87 | 95.87 | 95.87 | 95.87 | 95.87 |
| Inventories | 412.3 | 335.9 | 419.1 | 398.4 | 374.2 | 318.3 | 283.0 | 251.7 | 223.8 | 199.0 |
| Inventories, % | 24.8 | 35.55 | 48 | 43.83 | 40.23 | 38.48 | 38.48 | 38.48 | 38.48 | 38.48 |
| Accounts Payable | 257.2 | 284.8 | 427.9 | 509.5 | 511.3 | 340.2 | 302.5 | 269.0 | 239.2 | 212.7 |
| Accounts Payable, % | 15.47 | 30.14 | 49.01 | 56.05 | 54.97 | 41.13 | 41.13 | 41.13 | 41.13 | 41.13 |
| Capital Expenditure | -78.4 | -60.3 | -141.0 | -23.2 | -17.3 | -52.4 | -46.6 | -41.4 | -36.8 | -32.7 |
| Capital Expenditure, % | -4.72 | -6.38 | -16.15 | -2.56 | -1.86 | -6.33 | -6.33 | -6.33 | -6.33 | -6.33 |
| Tax Rate, % | 0.64432 | 0.64432 | 0.64432 | 0.64432 | 0.64432 | 0.64432 | 0.64432 | 0.64432 | 0.64432 | 0.64432 |
| EBITAT | 603.5 | 44.3 | -29.9 | -389.5 | -378.7 | -68.7 | -61.1 | -54.3 | -48.3 | -42.9 |
| Depreciation | ||||||||||
| Changes in Account Receivables | ||||||||||
| Changes in Inventories | ||||||||||
| Changes in Accounts Payable | ||||||||||
| Capital Expenditure | ||||||||||
| UFCF | -928.2 | 397.9 | -72.8 | -348.4 | -187.2 | 42.9 | 12.8 | 11.4 | 10.2 | 9.0 |
| WACC, % | 7.68 | 7.7 | 7.65 | 7.7 | 7.7 | 7.69 | 7.69 | 7.69 | 7.69 | 7.69 |
| PV UFCF | ||||||||||
| SUM PV UFCF | 73.8 | |||||||||
| Long Term Growth Rate, % | 2.00 | |||||||||
| Free cash flow (T + 1) | 9 | |||||||||
| Terminal Value | 162 | |||||||||
| Present Terminal Value | 112 | |||||||||
| Enterprise Value | 186 | |||||||||
| Net Debt | -239 | |||||||||
| Equity Value | 425 | |||||||||
| Diluted Shares Outstanding, MM | 213 | |||||||||
| Equity Value Per Share | 1.99 |
What You Will Receive
- Authentic Vanjee Financial Data: Pre-populated with Vanjee Technology’s historical and projected figures for accurate analysis.
- Completely Customizable Template: Easily adjust essential inputs such as revenue growth, WACC, and EBITDA percentage.
- Instant Calculations: Watch as Vanjee’s intrinsic value updates in real-time with your modifications.
- Expert Valuation Tool: Tailored for investors, analysts, and consultants aiming for precise DCF outcomes.
- Intuitive User Interface: Straightforward design and clear guidance suitable for all skill levels.
Key Features
- Accurate Financial Data for Vanjee Technology: Gain access to reliable, pre-loaded historical figures and future forecasts.
- Adjustable Forecast Parameters: Modify the highlighted cells for key inputs like WACC, growth rates, and profit margins.
- Automated Calculations: Experience real-time updates for DCF, Net Present Value (NPV), and cash flow evaluations.
- User-Friendly Dashboard: Intuitive charts and summaries that make visualizing your valuation findings effortless.
- For All Skill Levels: A straightforward and user-friendly design tailored for investors, CFOs, and consultants alike.
How It Works
- Step 1: Download the Excel file.
- Step 2: Review the pre-loaded Vanjee Technology data (historical and projected).
- Step 3: Modify key assumptions (yellow cells) according to your analysis.
- Step 4: Observe automatic recalculations for Vanjee Technology’s intrinsic value.
- Step 5: Utilize the outputs for investment decisions or reporting.
Reasons to Use Vanjee Technology Co., Ltd. (300552SZ) Calculator
- Time Efficient: Skip the hassle of building a DCF model from the ground up – it’s ready for immediate use.
- Enhanced Accuracy: Dependable financial data and formulas minimize valuation errors.
- Completely Customizable: Adjust the model to suit your specific assumptions and forecasts.
- User-Friendly: Intuitive charts and outputs simplify the analysis of results.
- Endorsed by Professionals: Crafted for users who prioritize precision and functionality.
Who Can Benefit from Vanjee Technology Co., Ltd. (300552SZ)?
- Investors: Assess Vanjee's market valuation prior to buying or selling shares.
- CFOs and Financial Analysts: Optimize valuation procedures and validate financial forecasts.
- Startup Founders: Discover valuation methods used for established tech companies like Vanjee.
- Consultants: Provide comprehensive valuation reports to your clients regarding Vanjee.
- Students and Educators: Utilize real data from Vanjee to practice and instruct on valuation strategies.
Contents of the Template
- Preloaded Vanjee Technology Data: Historical and projected financial information, encompassing revenue, EBIT, and capital expenditures.
- DCF and WACC Models: Professional-grade sheets designed for calculating intrinsic value and Weighted Average Cost of Capital.
- Editable Inputs: Yellow-highlighted cells that allow for adjustments to revenue growth, tax rates, and discount rates.
- Financial Statements: Detailed annual and quarterly financials for comprehensive analysis.
- Key Ratios: Metrics for profitability, leverage, and efficiency to assess overall performance.
- Dashboard and Charts: Visual presentations of valuation results and underlying assumptions.
Disclaimer
All information, articles, and product details provided on this website are for general informational and educational purposes only. We do not claim any ownership over, nor do we intend to infringe upon, any trademarks, copyrights, logos, brand names, or other intellectual property mentioned or depicted on this site. Such intellectual property remains the property of its respective owners, and any references here are made solely for identification or informational purposes, without implying any affiliation, endorsement, or partnership.
We make no representations or warranties, express or implied, regarding the accuracy, completeness, or suitability of any content or products presented. Nothing on this website should be construed as legal, tax, investment, financial, medical, or other professional advice. In addition, no part of this site—including articles or product references—constitutes a solicitation, recommendation, endorsement, advertisement, or offer to buy or sell any securities, franchises, or other financial instruments, particularly in jurisdictions where such activity would be unlawful.
All content is of a general nature and may not address the specific circumstances of any individual or entity. It is not a substitute for professional advice or services. Any actions you take based on the information provided here are strictly at your own risk. You accept full responsibility for any decisions or outcomes arising from your use of this website and agree to release us from any liability in connection with your use of, or reliance upon, the content or products found herein.