
|
Advanced Fiber Resources, Ltd. (300620.SZ) DCF Valoración |
Completamente Editable: Adáptelo A Sus Necesidades En Excel O Sheets
Diseño Profesional: Plantillas Confiables Y Estándares De La Industria
Predeterminadas Para Un Uso Rápido Y Eficiente
Compatible con MAC / PC, completamente desbloqueado
No Se Necesita Experiencia; Fáciles De Seguir
Advanced Fiber Resources (Zhuhai), Ltd. (300620.SZ) Bundle
¡Descubra el verdadero potencial de los recursos avanzados de fibra (Zhuhai), Ltd. (300620SZ) con nuestra calculadora DCF premium! Ajuste los supuestos clave, explore varios escenarios y evalúe cómo los diferentes factores influyen en la valoración de los recursos de fibra avanzada (Zhuhai), Ltd. (300620SZ), todo dentro de una plantilla de Excel conveniente.
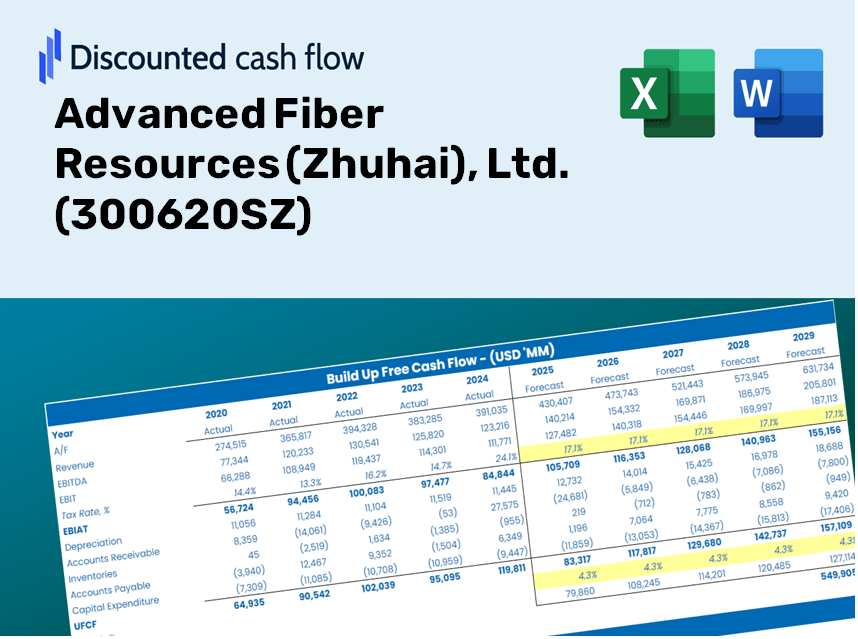
Discounted Cash Flow (DCF) - (USD MM)
| Year | AY1 2020 |
AY2 2021 |
AY3 2022 |
AY4 2023 |
AY5 2024 |
FY1 2025 |
FY2 2026 |
FY3 2027 |
FY4 2028 |
FY5 2029 |
|---|---|---|---|---|---|---|---|---|---|---|
| Revenue | 491.6 | 667.8 | 642.4 | 709.9 | 998.9 | 1,206.8 | 1,457.9 | 1,761.4 | 2,127.9 | 2,570.8 |
| Revenue Growth, % | 0 | 35.84 | -3.8 | 10.5 | 40.71 | 20.81 | 20.81 | 20.81 | 20.81 | 20.81 |
| EBITDA | 97.5 | 132.2 | 74.8 | 70.0 | 98.2 | 171.3 | 206.9 | 250.0 | 302.0 | 364.9 |
| EBITDA, % | 19.84 | 19.8 | 11.64 | 9.86 | 9.83 | 14.19 | 14.19 | 14.19 | 14.19 | 14.19 |
| Depreciation | 28.8 | 33.4 | 36.7 | 58.4 | 69.4 | 76.6 | 92.5 | 111.8 | 135.1 | 163.2 |
| Depreciation, % | 5.85 | 5 | 5.71 | 8.22 | 6.95 | 6.35 | 6.35 | 6.35 | 6.35 | 6.35 |
| EBIT | 68.8 | 98.8 | 38.1 | 11.6 | 28.8 | 94.7 | 114.4 | 138.2 | 167.0 | 201.7 |
| EBIT, % | 13.99 | 14.79 | 5.93 | 1.64 | 2.88 | 7.85 | 7.85 | 7.85 | 7.85 | 7.85 |
| Total Cash | 844.6 | 771.8 | 565.4 | 387.1 | 947.9 | 1,055.7 | 1,275.5 | 1,540.9 | 1,861.6 | 2,249.1 |
| Total Cash, percent | .0 | .0 | .0 | .0 | .0 | .0 | .0 | .0 | .0 | .0 |
| Account Receivables | 171.3 | 244.6 | 267.3 | 330.7 | 413.7 | 485.3 | 586.3 | 708.3 | 855.7 | 1,033.8 |
| Account Receivables, % | 34.84 | 36.63 | 41.61 | 46.58 | 41.41 | 40.21 | 40.21 | 40.21 | 40.21 | 40.21 |
| Inventories | 102.9 | 179.6 | 241.2 | 232.7 | 268.3 | 350.0 | 422.9 | 510.9 | 617.2 | 745.7 |
| Inventories, % | 20.94 | 26.9 | 37.54 | 32.78 | 26.87 | 29.01 | 29.01 | 29.01 | 29.01 | 29.01 |
| Accounts Payable | 49.6 | 62.4 | 144.3 | 105.1 | 172.8 | 178.5 | 215.7 | 260.6 | 314.8 | 380.3 |
| Accounts Payable, % | 10.08 | 9.34 | 22.45 | 14.8 | 17.3 | 14.79 | 14.79 | 14.79 | 14.79 | 14.79 |
| Capital Expenditure | -158.4 | -166.8 | -260.3 | -238.0 | -152.1 | -353.5 | -427.1 | -516.0 | -623.4 | -753.1 |
| Capital Expenditure, % | -32.22 | -24.97 | -40.52 | -33.53 | -15.23 | -29.3 | -29.3 | -29.3 | -29.3 | -29.3 |
| Tax Rate, % | -11.84 | -11.84 | -11.84 | -11.84 | -11.84 | -11.84 | -11.84 | -11.84 | -11.84 | -11.84 |
| EBITAT | 63.4 | 89.5 | 40.8 | 14.1 | 32.2 | 91.4 | 110.5 | 133.5 | 161.2 | 194.8 |
| Depreciation | ||||||||||
| Changes in Account Receivables | ||||||||||
| Changes in Inventories | ||||||||||
| Changes in Accounts Payable | ||||||||||
| Capital Expenditure | ||||||||||
| UFCF | -290.9 | -181.0 | -185.2 | -259.7 | -101.4 | -333.1 | -360.8 | -435.9 | -526.6 | -636.2 |
| WACC, % | 8.34 | 8.34 | 8.35 | 8.35 | 8.35 | 8.34 | 8.34 | 8.34 | 8.34 | 8.34 |
| PV UFCF | ||||||||||
| SUM PV UFCF | -1,765.9 | |||||||||
| Long Term Growth Rate, % | 4.00 | |||||||||
| Free cash flow (T + 1) | -662 | |||||||||
| Terminal Value | -15,236 | |||||||||
| Present Terminal Value | -10,206 | |||||||||
| Enterprise Value | -11,972 | |||||||||
| Net Debt | -421 | |||||||||
| Equity Value | -11,551 | |||||||||
| Diluted Shares Outstanding, MM | 249 | |||||||||
| Equity Value Per Share | -46.41 |
What You Will Receive
- Genuine AFR Data: Preloaded financial metrics – from revenue to EBIT – derived from actual and projected statistics.
- Complete Customizability: Modify all key parameters (yellow cells) such as WACC, growth %, and tax rates.
- Real-Time Valuation Updates: Automatic recalculations to assess the effects of changes on AFR’s fair value.
- Flexible Excel Template: Designed for quick adjustments, scenario analysis, and comprehensive projections.
- Efficient and Precise: Avoid starting models from scratch while ensuring accuracy and adaptability.
Key Features
- Comprehensive Financial Insights: Gain access to precise historical data and future projections for Advanced Fiber Resources (Zhuhai), Ltd. (300620SZ).
- Tailorable Forecast Inputs: Modify highlighted fields such as WACC, growth rates, and profit margins with ease.
- Real-Time Calculations: Enjoy automatic updates for DCF, Net Present Value (NPV), and cash flow assessments.
- User-Friendly Dashboard: Utilize intuitive charts and summaries for a clear visualization of your valuation outcomes.
- Designed for All Skill Levels: A straightforward layout tailored for investors, CFOs, and consultants alike.
How It Works
- Step 1: Download the Excel file for Advanced Fiber Resources (Zhuhai), Ltd. (300620SZ).
- Step 2: Examine the pre-filled financial data and projections for Advanced Fiber Resources.
- Step 3: Adjust key variables such as revenue growth, WACC, and tax rates (highlighted cells).
- Step 4: Observe the DCF model refresh in real-time as you modify your assumptions.
- Step 5: Review the outputs and leverage the findings for your investment strategies.
Why Opt for This Calculator?
- All-in-One Solution: Features DCF, WACC, and financial ratio evaluations seamlessly integrated.
- Flexible Inputs: Modify the highlighted cells to explore different financial scenarios.
- In-Depth Analysis: Automatically computes Advanced Fiber Resources’ intrinsic value and Net Present Value.
- Preloaded Information: Access historical and projected data for reliable starting points.
- High-Quality Standards: Perfect for financial analysts, investors, and business consultants alike.
Who Can Benefit from Our Solutions?
- Investors: Enhance your investment strategies with our top-tier valuation tools.
- Financial Analysts: Streamline your workflow with an easy-to-modify DCF model.
- Consultants: Effortlessly tailor templates for impactful client presentations and reports.
- Finance Enthusiasts: Expand your knowledge of valuation methods through practical case studies.
- Educators and Students: Leverage our resources as effective learning aids in finance courses.
Contents of the Template
- Pre-Filled Data: Contains Advanced Fiber Resources (Zhuhai), Ltd.'s historical financials and projections.
- Discounted Cash Flow Model: An editable DCF valuation model featuring automatic calculations.
- Weighted Average Cost of Capital (WACC): A dedicated worksheet for WACC calculation based on user-defined inputs.
- Key Financial Ratios: Assess Advanced Fiber Resources (Zhuhai), Ltd.’s profitability, efficiency, and leverage ratios.
- Customizable Inputs: Easily modify revenue growth rates, profit margins, and tax rates.
- Intuitive Dashboard: Visual representations and tables summarizing essential valuation outcomes.
Disclaimer
All information, articles, and product details provided on this website are for general informational and educational purposes only. We do not claim any ownership over, nor do we intend to infringe upon, any trademarks, copyrights, logos, brand names, or other intellectual property mentioned or depicted on this site. Such intellectual property remains the property of its respective owners, and any references here are made solely for identification or informational purposes, without implying any affiliation, endorsement, or partnership.
We make no representations or warranties, express or implied, regarding the accuracy, completeness, or suitability of any content or products presented. Nothing on this website should be construed as legal, tax, investment, financial, medical, or other professional advice. In addition, no part of this site—including articles or product references—constitutes a solicitation, recommendation, endorsement, advertisement, or offer to buy or sell any securities, franchises, or other financial instruments, particularly in jurisdictions where such activity would be unlawful.
All content is of a general nature and may not address the specific circumstances of any individual or entity. It is not a substitute for professional advice or services. Any actions you take based on the information provided here are strictly at your own risk. You accept full responsibility for any decisions or outcomes arising from your use of this website and agree to release us from any liability in connection with your use of, or reliance upon, the content or products found herein.