
|
Zhejiang Tianyu Pharmaceutical Co., Ltd. (300702.SZ) DCF Valoración |
Completamente Editable: Adáptelo A Sus Necesidades En Excel O Sheets
Diseño Profesional: Plantillas Confiables Y Estándares De La Industria
Predeterminadas Para Un Uso Rápido Y Eficiente
Compatible con MAC / PC, completamente desbloqueado
No Se Necesita Experiencia; Fáciles De Seguir
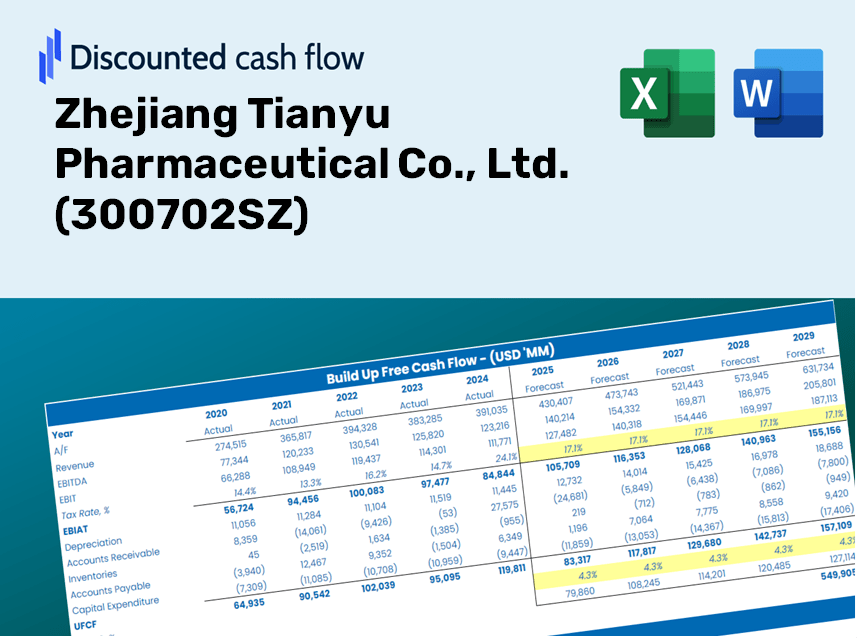
Zhejiang Tianyu Pharmaceutical Co., Ltd. (300702.SZ) Bundle
¡Descubra el verdadero valor de Zhejiang Tianyu Pharmaceutical Co., Ltd. (300702SZ) con nuestra calculadora DCF avanzada! Ajuste los supuestos clave, explore varios escenarios y evalúe cómo los cambios afectan la valoración de Zhejiang Tianyu Pharmaceutical Co., Ltd. (300702SZ), todo dentro de una plantilla de Excel amigable con el uso de usuarios.
Discounted Cash Flow (DCF) - (USD MM)
| Year | AY1 2020 |
AY2 2021 |
AY3 2022 |
AY4 2023 |
AY5 2024 |
FY1 2025 |
FY2 2026 |
FY3 2027 |
FY4 2028 |
FY5 2029 |
|---|---|---|---|---|---|---|---|---|---|---|
| Revenue | 2,587.4 | 2,545.0 | 2,666.7 | 2,527.3 | 2,630.8 | 2,644.0 | 2,657.3 | 2,670.7 | 2,684.1 | 2,697.6 |
| Revenue Growth, % | 0 | -1.64 | 4.78 | -5.23 | 4.1 | 0.50289 | 0.50289 | 0.50289 | 0.50289 | 0.50289 |
| EBITDA | 855.5 | 371.0 | 164.6 | 439.7 | 432.5 | 463.5 | 465.9 | 468.2 | 470.5 | 472.9 |
| EBITDA, % | 33.06 | 14.58 | 6.17 | 17.4 | 16.44 | 17.53 | 17.53 | 17.53 | 17.53 | 17.53 |
| Depreciation | 136.1 | 185.2 | 244.2 | 293.6 | 321.4 | 240.8 | 242.0 | 243.2 | 244.4 | 245.7 |
| Depreciation, % | 5.26 | 7.28 | 9.16 | 11.62 | 12.22 | 9.11 | 9.11 | 9.11 | 9.11 | 9.11 |
| EBIT | 719.4 | 185.8 | -79.7 | 146.1 | 111.1 | 222.7 | 223.9 | 225.0 | 226.1 | 227.3 |
| EBIT, % | 27.8 | 7.3 | -2.99 | 5.78 | 4.22 | 8.42 | 8.42 | 8.42 | 8.42 | 8.42 |
| Total Cash | 1,334.1 | 549.7 | 477.0 | 426.2 | 592.9 | 689.8 | 693.3 | 696.8 | 700.3 | 703.8 |
| Total Cash, percent | .0 | .0 | .0 | .0 | .0 | .0 | .0 | .0 | .0 | .0 |
| Account Receivables | 524.5 | 489.1 | 461.6 | 583.1 | 596.2 | 542.2 | 544.9 | 547.7 | 550.4 | 553.2 |
| Account Receivables, % | 20.27 | 19.22 | 17.31 | 23.07 | 22.66 | 20.51 | 20.51 | 20.51 | 20.51 | 20.51 |
| Inventories | 994.8 | 1,598.5 | 2,017.2 | 1,889.7 | 1,880.7 | 1,708.9 | 1,717.5 | 1,726.1 | 1,734.8 | 1,743.5 |
| Inventories, % | 38.45 | 62.81 | 75.64 | 74.77 | 71.49 | 64.63 | 64.63 | 64.63 | 64.63 | 64.63 |
| Accounts Payable | 803.6 | 1,172.6 | 1,357.7 | 803.1 | 961.1 | 1,038.3 | 1,043.6 | 1,048.8 | 1,054.1 | 1,059.4 |
| Accounts Payable, % | 31.06 | 46.08 | 50.91 | 31.78 | 36.53 | 39.27 | 39.27 | 39.27 | 39.27 | 39.27 |
| Capital Expenditure | -506.1 | -736.4 | -527.0 | -316.8 | -168.9 | -461.2 | -463.5 | -465.8 | -468.2 | -470.5 |
| Capital Expenditure, % | -19.56 | -28.93 | -19.76 | -12.54 | -6.42 | -17.44 | -17.44 | -17.44 | -17.44 | -17.44 |
| Tax Rate, % | 28.87 | 28.87 | 28.87 | 28.87 | 28.87 | 28.87 | 28.87 | 28.87 | 28.87 | 28.87 |
| EBITAT | 624.1 | 174.2 | -85.7 | 55.6 | 79.0 | 173.6 | 174.5 | 175.3 | 176.2 | 177.1 |
| Depreciation | ||||||||||
| Changes in Account Receivables | ||||||||||
| Changes in Inventories | ||||||||||
| Changes in Accounts Payable | ||||||||||
| Capital Expenditure | ||||||||||
| UFCF | -461.5 | -576.3 | -574.6 | -516.2 | 385.3 | 256.3 | -53.2 | -53.4 | -53.7 | -54.0 |
| WACC, % | 8.21 | 8.25 | 8.29 | 7.92 | 8.12 | 8.16 | 8.16 | 8.16 | 8.16 | 8.16 |
| PV UFCF | ||||||||||
| SUM PV UFCF | 73.5 | |||||||||
| Long Term Growth Rate, % | 4.00 | |||||||||
| Free cash flow (T + 1) | -56 | |||||||||
| Terminal Value | -1,350 | |||||||||
| Present Terminal Value | -912 | |||||||||
| Enterprise Value | -838 | |||||||||
| Net Debt | 1,150 | |||||||||
| Equity Value | -1,988 | |||||||||
| Diluted Shares Outstanding, MM | 350 | |||||||||
| Equity Value Per Share | -5.69 |
What You Will Receive
- Accurate ZTP Financial Data: Provides historical and projected figures for precise valuation.
- Customizable Inputs: Adjust WACC, tax rates, revenue growth, and capital expenditure parameters.
- Real-Time Calculations: Automatically computes intrinsic value and NPV as data changes.
- Scenario Testing: Analyze various scenarios to assess the future performance of Zhejiang Tianyu Pharmaceutical Co., Ltd. (300702SZ).
- User-Friendly Interface: Designed for professionals while remaining accessible to newcomers.
Key Features
- Real-Life ZTP Data: Pre-filled with Zhejiang Tianyu Pharmaceutical's historical financials and future projections.
- Fully Customizable Inputs: Adjust revenue growth rates, profit margins, WACC, tax rates, and capital expenditures.
- Dynamic Valuation Model: Automatically updates Net Present Value (NPV) and intrinsic value based on your customized inputs.
- Scenario Testing: Develop multiple forecasting scenarios to assess different valuation results.
- User-Friendly Design: Clean, organized layout suitable for both professionals and newcomers.
How It Works
- Step 1: Download the prebuilt Excel template featuring Zhejiang Tianyu Pharmaceutical Co., Ltd.'s data.
- Step 2: Navigate through the pre-filled sheets to familiarize yourself with the essential metrics.
- Step 3: Adjust forecasts and assumptions in the editable yellow cells (WACC, growth, margins).
- Step 4: Instantly view the updated results, including the intrinsic value of Zhejiang Tianyu Pharmaceutical Co., Ltd. (300702SZ).
- Step 5: Make well-informed investment choices or create reports utilizing the generated outputs.
Why Choose Our Financial Calculator for Zhejiang Tianyu Pharmaceutical Co., Ltd. (300702SZ)?
- All-in-One Solution: Integrates DCF, WACC, and financial ratio analyses into a single platform.
- Flexible Configurations: Modify the highlighted cells to explore different financial scenarios.
- In-Depth Analysis: Automatically computes the intrinsic value and Net Present Value for Zhejiang Tianyu Pharmaceutical.
- Preloaded Information: Access to historical and projected data sets for reliable baseline calculations.
- Industry-Grade Quality: Perfect for financial analysts, investors, and business consultants focused on [Symbol].
Who Can Benefit from This Product?
- Investors: Accurately assess the fair value of Zhejiang Tianyu Pharmaceutical Co., Ltd. (300702SZ) for informed investment choices.
- CFOs: Utilize a professional-grade DCF model for comprehensive financial analysis and reporting.
- Consultants: Effortlessly customize the template for client valuation reports.
- Entrepreneurs: Learn financial modeling strategies employed by leading pharmaceutical firms.
- Educators: Employ it as a teaching resource to illustrate various valuation techniques.
Contents of the Template
- Preloaded ZT Pharmaceuticals Data: Historical and forecasted financial metrics, encompassing revenue, EBIT, and capital expenditures.
- DCF and WACC Models: Advanced worksheets designed for calculating intrinsic value and Weighted Average Cost of Capital.
- Editable Inputs: Cells highlighted in yellow for modifying revenue growth, tax rates, and discount rates.
- Financial Statements: Detailed annual and quarterly financial reports for in-depth analysis.
- Key Ratios: Metrics on profitability, leverage, and efficiency to assess company performance.
- Dashboard and Charts: Visual representations summarizing valuation results and underlying assumptions.
Disclaimer
All information, articles, and product details provided on this website are for general informational and educational purposes only. We do not claim any ownership over, nor do we intend to infringe upon, any trademarks, copyrights, logos, brand names, or other intellectual property mentioned or depicted on this site. Such intellectual property remains the property of its respective owners, and any references here are made solely for identification or informational purposes, without implying any affiliation, endorsement, or partnership.
We make no representations or warranties, express or implied, regarding the accuracy, completeness, or suitability of any content or products presented. Nothing on this website should be construed as legal, tax, investment, financial, medical, or other professional advice. In addition, no part of this site—including articles or product references—constitutes a solicitation, recommendation, endorsement, advertisement, or offer to buy or sell any securities, franchises, or other financial instruments, particularly in jurisdictions where such activity would be unlawful.
All content is of a general nature and may not address the specific circumstances of any individual or entity. It is not a substitute for professional advice or services. Any actions you take based on the information provided here are strictly at your own risk. You accept full responsibility for any decisions or outcomes arising from your use of this website and agree to release us from any liability in connection with your use of, or reliance upon, the content or products found herein.