
|
Pharmablock Sciences, Inc. (300725.SZ) DCF Valoración |
Completamente Editable: Adáptelo A Sus Necesidades En Excel O Sheets
Diseño Profesional: Plantillas Confiables Y Estándares De La Industria
Predeterminadas Para Un Uso Rápido Y Eficiente
Compatible con MAC / PC, completamente desbloqueado
No Se Necesita Experiencia; Fáciles De Seguir
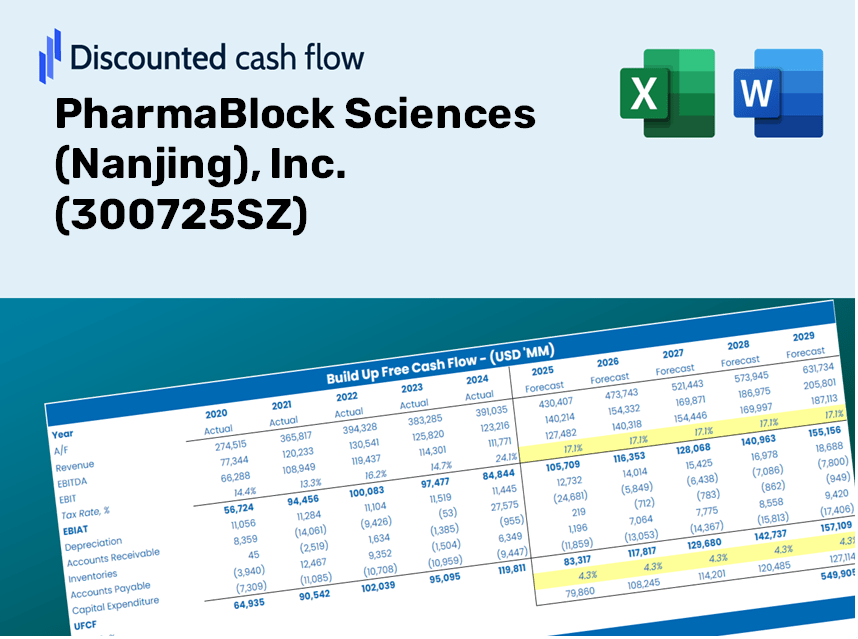
PharmaBlock Sciences (Nanjing), Inc. (300725.SZ) Bundle
¡Evalúe la perspectiva financiera de Pharmablock Sciences (Nanjing), Inc. como un experto! Esta calculadora DCF (300725SZ) proporciona datos financieros preconsados, al tiempo que le ofrece flexibilidad total para modificar el crecimiento de los ingresos, WACC, los márgenes y otros supuestos esenciales para alinearse con sus proyecciones.
Discounted Cash Flow (DCF) - (USD MM)
| Year | AY1 2020 |
AY2 2021 |
AY3 2022 |
AY4 2023 |
AY5 2024 |
FY1 2025 |
FY2 2026 |
FY3 2027 |
FY4 2028 |
FY5 2029 |
|---|---|---|---|---|---|---|---|---|---|---|
| Revenue | 1,022.2 | 1,201.6 | 1,594.7 | 1,725.2 | 1,688.6 | 1,926.4 | 2,197.7 | 2,507.1 | 2,860.1 | 3,262.9 |
| Revenue Growth, % | 0 | 17.55 | 32.71 | 8.18 | -2.12 | 14.08 | 14.08 | 14.08 | 14.08 | 14.08 |
| EBITDA | 236.3 | 322.6 | 366.5 | 374.2 | 355.4 | 445.7 | 508.5 | 580.1 | 661.7 | 754.9 |
| EBITDA, % | 23.11 | 26.85 | 22.98 | 21.69 | 21.05 | 23.14 | 23.14 | 23.14 | 23.14 | 23.14 |
| Depreciation | 24.5 | 53.2 | 86.2 | 114.3 | 128.8 | 102.0 | 116.4 | 132.8 | 151.5 | 172.8 |
| Depreciation, % | 2.39 | 4.43 | 5.41 | 6.63 | 7.63 | 5.3 | 5.3 | 5.3 | 5.3 | 5.3 |
| EBIT | 211.8 | 269.4 | 280.2 | 260.0 | 226.6 | 343.7 | 392.1 | 447.3 | 510.3 | 582.1 |
| EBIT, % | 20.72 | 22.42 | 17.57 | 15.07 | 13.42 | 17.84 | 17.84 | 17.84 | 17.84 | 17.84 |
| Total Cash | 1,352.4 | 1,004.1 | 1,313.7 | 1,600.8 | 755.8 | 1,554.5 | 1,773.4 | 2,023.2 | 2,308.1 | 2,633.1 |
| Total Cash, percent | .0 | .0 | .0 | .0 | .0 | .0 | .0 | .0 | .0 | .0 |
| Account Receivables | 168.4 | 203.4 | 332.4 | 476.3 | 485.6 | 426.2 | 486.2 | 554.6 | 632.7 | 721.8 |
| Account Receivables, % | 16.47 | 16.93 | 20.85 | 27.61 | 28.76 | 22.12 | 22.12 | 22.12 | 22.12 | 22.12 |
| Inventories | 309.6 | 447.9 | 676.4 | 724.8 | 840.2 | 777.3 | 886.7 | 1,011.6 | 1,154.1 | 1,316.6 |
| Inventories, % | 30.29 | 37.28 | 42.41 | 42.01 | 49.75 | 40.35 | 40.35 | 40.35 | 40.35 | 40.35 |
| Accounts Payable | 183.7 | 134.3 | 413.5 | 193.4 | 292.2 | 322.0 | 367.4 | 419.1 | 478.1 | 545.5 |
| Accounts Payable, % | 17.97 | 11.18 | 25.93 | 11.21 | 17.3 | 16.72 | 16.72 | 16.72 | 16.72 | 16.72 |
| Capital Expenditure | -75.2 | -505.8 | -557.9 | -315.8 | -118.1 | -422.8 | -482.3 | -550.2 | -627.7 | -716.1 |
| Capital Expenditure, % | -7.35 | -42.09 | -34.99 | -18.3 | -7 | -21.95 | -21.95 | -21.95 | -21.95 | -21.95 |
| Tax Rate, % | 11.79 | 11.79 | 11.79 | 11.79 | 11.79 | 11.79 | 11.79 | 11.79 | 11.79 | 11.79 |
| EBITAT | 190.8 | 258.2 | 272.4 | 231.8 | 199.9 | 316.5 | 361.1 | 411.9 | 469.9 | 536.1 |
| Depreciation | ||||||||||
| Changes in Account Receivables | ||||||||||
| Changes in Inventories | ||||||||||
| Changes in Accounts Payable | ||||||||||
| Capital Expenditure | ||||||||||
| UFCF | -154.3 | -417.1 | -277.6 | -382.0 | 184.6 | 147.9 | -128.9 | -147.1 | -167.8 | -191.4 |
| WACC, % | 11.03 | 11.07 | 11.08 | 11.03 | 11.02 | 11.05 | 11.05 | 11.05 | 11.05 | 11.05 |
| PV UFCF | ||||||||||
| SUM PV UFCF | -302.5 | |||||||||
| Long Term Growth Rate, % | 3.50 | |||||||||
| Free cash flow (T + 1) | -198 | |||||||||
| Terminal Value | -2,626 | |||||||||
| Present Terminal Value | -1,555 | |||||||||
| Enterprise Value | -1,858 | |||||||||
| Net Debt | 1,070 | |||||||||
| Equity Value | -2,927 | |||||||||
| Diluted Shares Outstanding, MM | 200 | |||||||||
| Equity Value Per Share | -14.67 |
What You Will Receive
- Authentic PharmaBlock Data: Comprehensive financials – encompassing revenue through EBIT – drawn from both actual and forecasted figures.
- Complete Customization: Modify all essential parameters (yellow cells) such as WACC, growth %, and tax rates to fit your analysis.
- Immediate Valuation Updates: Automatic recalculations to assess how changes affect the fair value of PharmaBlock Sciences (300725SZ).
- Flexible Excel Template: Designed for swift modifications, scenario simulations, and thorough projections.
- Efficient and Accurate: Eliminate the need to create models from the ground up while ensuring precision and adaptability.
Key Features
- 🔍 Real-Life PharmaBlock Financials: Pre-filled historical and projected data for PharmaBlock Sciences (Nanjing), Inc. (300725SZ).
- ✏️ Fully Customizable Inputs: Modify all essential parameters (yellow cells) such as WACC, growth %, and tax rates.
- 📊 Professional DCF Valuation: Integrated formulas assess PharmaBlock’s intrinsic value using the Discounted Cash Flow approach.
- ⚡ Instant Results: View PharmaBlock’s valuation in real-time after applying changes.
- Scenario Analysis: Evaluate and compare results for different financial assumptions side-by-side.
How It Functions
- Step 1: Download the Excel spreadsheet.
- Step 2: Examine the pre-filled PharmaBlock Sciences (Nanjing), Inc. (300725SZ) data (both historical and projected).
- Step 3: Modify key assumptions (marked in yellow) based on your insights.
- Step 4: Observe automatic updates reflecting PharmaBlock's intrinsic value.
- Step 5: Utilize the results for your investment decisions or reporting needs.
Why Choose This Calculator for PharmaBlock Sciences (300725SZ)?
- User-Friendly Interface: Designed to accommodate both beginners and seasoned professionals.
- Customizable Inputs: Modify assumptions effortlessly to suit your analytical needs.
- Real-Time Updates: Observe immediate changes in PharmaBlock's valuation as you adjust your inputs.
- Preloaded Financial Data: Comes with PharmaBlock’s actual financial information for swift analysis.
- Relied Upon by Experts: Trusted by investors and analysts for making well-informed decisions.
Who Can Benefit from This Product?
- Investors: Accurately assess PharmaBlock’s fair value prior to making investment choices.
- CFOs: Utilize a top-tier DCF model for comprehensive financial reporting and analysis.
- Consultants: Easily customize the template for valuation reports tailored to client needs.
- Entrepreneurs: Discover insights into the financial modeling practices of leading pharmaceutical companies.
- Educators: Implement it as a teaching resource to illustrate various valuation techniques.
Contents of the Template
- Detailed DCF Model: Editable template featuring comprehensive valuation calculations.
- Real-World Data: PharmaBlock Sciences' historical and projected financials preloaded for in-depth analysis.
- Customizable Parameters: Modify WACC, growth rates, and tax assumptions to explore various scenarios.
- Financial Statements: Complete annual and quarterly breakdowns for enhanced insights.
- Key Ratios: Integrated analysis for profitability, efficiency, and leverage metrics.
- Dashboard with Visual Outputs: Visualizations including charts and tables for clear, actionable results.
Disclaimer
All information, articles, and product details provided on this website are for general informational and educational purposes only. We do not claim any ownership over, nor do we intend to infringe upon, any trademarks, copyrights, logos, brand names, or other intellectual property mentioned or depicted on this site. Such intellectual property remains the property of its respective owners, and any references here are made solely for identification or informational purposes, without implying any affiliation, endorsement, or partnership.
We make no representations or warranties, express or implied, regarding the accuracy, completeness, or suitability of any content or products presented. Nothing on this website should be construed as legal, tax, investment, financial, medical, or other professional advice. In addition, no part of this site—including articles or product references—constitutes a solicitation, recommendation, endorsement, advertisement, or offer to buy or sell any securities, franchises, or other financial instruments, particularly in jurisdictions where such activity would be unlawful.
All content is of a general nature and may not address the specific circumstances of any individual or entity. It is not a substitute for professional advice or services. Any actions you take based on the information provided here are strictly at your own risk. You accept full responsibility for any decisions or outcomes arising from your use of this website and agree to release us from any liability in connection with your use of, or reliance upon, the content or products found herein.