
|
Jushri Technologies, inc. (300762.SZ) DCF Valoración |
Completamente Editable: Adáptelo A Sus Necesidades En Excel O Sheets
Diseño Profesional: Plantillas Confiables Y Estándares De La Industria
Predeterminadas Para Un Uso Rápido Y Eficiente
Compatible con MAC / PC, completamente desbloqueado
No Se Necesita Experiencia; Fáciles De Seguir
Jushri Technologies, INC. (300762.SZ) Bundle
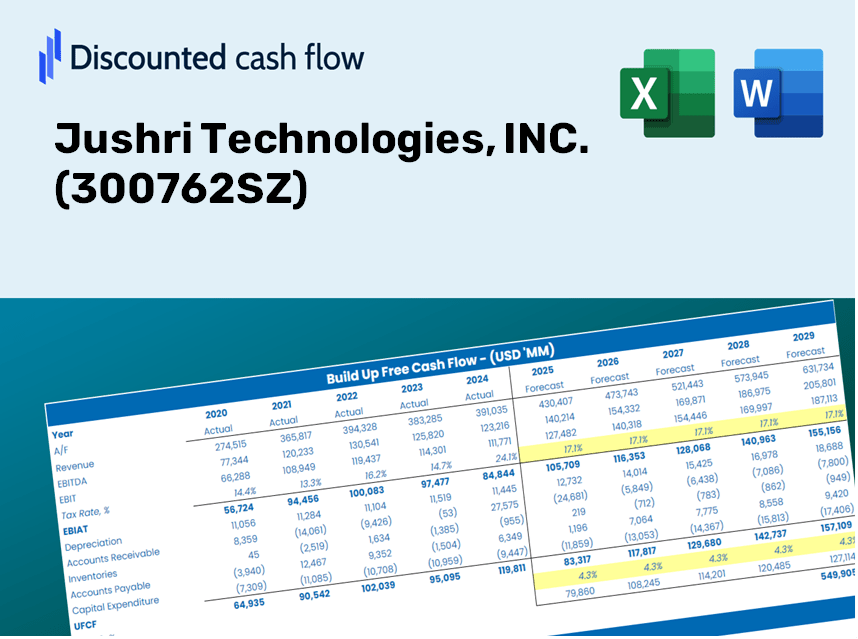
¡Explore Jushri Technologies, Inc. Financial Future con nuestra calculadora DCF fácil de usar! Ingrese sus suposiciones para el crecimiento, los márgenes y los costos para determinar el valor intrínseco de Jushri Technologies, Inc. y dar forma a su estrategia de inversión. [Símbolo] (300762SZ)
Discounted Cash Flow (DCF) - (USD MM)
| Year | AY1 2020 |
AY2 2021 |
AY3 2022 |
AY4 2023 |
AY5 2024 |
FY1 2025 |
FY2 2026 |
FY3 2027 |
FY4 2028 |
FY5 2029 |
|---|---|---|---|---|---|---|---|---|---|---|
| Revenue | 640.9 | 729.2 | 400.6 | 312.7 | 353.3 | 317.8 | 285.8 | 257.1 | 231.2 | 208.0 |
| Revenue Growth, % | 0 | 13.79 | -45.07 | -21.93 | 12.97 | -10.06 | -10.06 | -10.06 | -10.06 | -10.06 |
| EBITDA | 145.1 | 218.1 | 37.4 | -244.7 | -135.1 | -34.7 | -31.2 | -28.1 | -25.2 | -22.7 |
| EBITDA, % | 22.64 | 29.91 | 9.34 | -78.25 | -38.23 | -10.92 | -10.92 | -10.92 | -10.92 | -10.92 |
| Depreciation | 6.3 | 24.6 | 26.3 | 58.6 | 69.0 | 31.3 | 28.1 | 25.3 | 22.8 | 20.5 |
| Depreciation, % | 0.98309 | 3.37 | 6.56 | 18.75 | 19.54 | 9.84 | 9.84 | 9.84 | 9.84 | 9.84 |
| EBIT | 138.8 | 193.5 | 11.1 | -303.4 | -204.1 | -66.0 | -59.3 | -53.4 | -48.0 | -43.2 |
| EBIT, % | 21.66 | 26.54 | 2.78 | -97 | -57.77 | -20.76 | -20.76 | -20.76 | -20.76 | -20.76 |
| Total Cash | 463.7 | 1,488.2 | 1,435.5 | 1,407.1 | 1,415.2 | 300.2 | 270.0 | 242.9 | 218.4 | 196.5 |
| Total Cash, percent | .0 | .0 | .0 | .0 | .0 | .0 | .0 | .0 | .0 | .0 |
| Account Receivables | 1,075.1 | 1,234.1 | 1,093.7 | 1,001.5 | 978.2 | 317.8 | 285.8 | 257.1 | 231.2 | 208.0 |
| Account Receivables, % | 167.76 | 169.23 | 273.01 | 320.22 | 276.84 | 100 | 100 | 100 | 100 | 100 |
| Inventories | 161.8 | 220.1 | 278.0 | 285.1 | 368.9 | 200.8 | 180.6 | 162.5 | 146.1 | 131.4 |
| Inventories, % | 25.24 | 30.18 | 69.38 | 91.16 | 104.41 | 63.19 | 63.19 | 63.19 | 63.19 | 63.19 |
| Accounts Payable | 227.0 | 423.6 | 359.1 | 304.0 | 261.5 | 225.2 | 202.6 | 182.2 | 163.9 | 147.4 |
| Accounts Payable, % | 35.42 | 58.09 | 89.64 | 97.21 | 74.01 | 70.87 | 70.87 | 70.87 | 70.87 | 70.87 |
| Capital Expenditure | -94.5 | -167.5 | -194.1 | -106.1 | -157.3 | -104.6 | -94.1 | -84.6 | -76.1 | -68.5 |
| Capital Expenditure, % | -14.74 | -22.97 | -48.44 | -33.92 | -44.53 | -32.92 | -32.92 | -32.92 | -32.92 | -32.92 |
| Tax Rate, % | 26.92 | 26.92 | 26.92 | 26.92 | 26.92 | 26.92 | 26.92 | 26.92 | 26.92 | 26.92 |
| EBITAT | 135.0 | 181.6 | 14.0 | -226.3 | -149.2 | -57.9 | -52.1 | -46.8 | -42.1 | -37.9 |
| Depreciation | ||||||||||
| Changes in Account Receivables | ||||||||||
| Changes in Inventories | ||||||||||
| Changes in Accounts Payable | ||||||||||
| Capital Expenditure | ||||||||||
| UFCF | -963.0 | 18.0 | -135.8 | -243.8 | -340.5 | 661.0 | -88.5 | -79.6 | -71.6 | -64.4 |
| WACC, % | 9.71 | 9.7 | 9.72 | 9.67 | 9.67 | 9.69 | 9.69 | 9.69 | 9.69 | 9.69 |
| PV UFCF | ||||||||||
| SUM PV UFCF | 378.6 | |||||||||
| Long Term Growth Rate, % | 2.00 | |||||||||
| Free cash flow (T + 1) | -66 | |||||||||
| Terminal Value | -854 | |||||||||
| Present Terminal Value | -538 | |||||||||
| Enterprise Value | -159 | |||||||||
| Net Debt | -515 | |||||||||
| Equity Value | 356 | |||||||||
| Diluted Shares Outstanding, MM | 619 | |||||||||
| Equity Value Per Share | 0.58 |
What You Will Receive
- Authentic Jushri Data: Preloaded financial metrics – encompassing revenue to EBIT – based on real and forecasted figures.
- Comprehensive Customization: Modify all essential parameters (yellow cells) including WACC, growth %, and tax rates.
- Immediate Valuation Updates: Automatic recalculations to assess the impact of changes on Jushri Technologies’ fair value.
- Dynamic Excel Template: Designed for easy edits, scenario analysis, and in-depth projections.
- Efficient and Accurate: Bypass the need to create models from the ground up while ensuring precision and adaptability.
Key Features
- Comprehensive Data: Jushri Technologies' historical financial records and pre-filled projections.
- Customizable Parameters: Modify WACC, tax rates, revenue growth, and EBITDA margins to suit your analysis.
- Real-Time Results: Instantly view the recalculated intrinsic value of Jushri Technologies in response to input changes.
- Intuitive Visuals: Dashboard charts provide clear displays of valuation outcomes and essential metrics.
- Designed for Precision: A specialized tool crafted for analysts, investors, and finance professionals.
How It Functions
- Download: Acquire the pre-configured Excel file containing the financial data for Jushri Technologies, INC. (300762SZ).
- Customize: Modify forecasts, including anticipated revenue growth, EBITDA percentage, and WACC.
- Update Automatically: The intrinsic value and NPV calculations refresh in real-time.
- Test Scenarios: Generate multiple projections and instantly compare the results.
- Make Decisions: Leverage the valuation outcomes to inform your investment strategy.
Why Choose Jushri Technologies, INC. (300762SZ) Calculator?
- User-Friendly Interface: Tailored for both novices and seasoned professionals.
- Customizable Inputs: Easily adjust parameters to suit your financial analysis needs.
- Real-Time Valuation Updates: Monitor immediate changes in Jushri Technologies' valuation as you tweak the inputs.
- Preloaded Financial Data: Comes with Jushri Technologies' historical financial information for swift evaluations.
- Endorsed by Industry Experts: Favored by investors and analysts for making well-informed decisions.
Who Can Benefit from Jushri Technologies, INC. Products?
- Institutional Investors: Develop comprehensive and trustworthy valuation models for assessing investment opportunities in Jushri Technologies (300762SZ).
- Corporate Finance Departments: Evaluate valuation scenarios to inform strategic decision-making within their organizations.
- Consultants and Financial Advisors: Deliver precise valuation insights and recommendations regarding Jushri Technologies (300762SZ) to their clients.
- Academics and Students: Utilize real-world data to enhance their understanding and instruction of financial modeling practices.
- Technology Analysts: Gain insights into the market valuation of companies like Jushri Technologies (300762SZ).
Components of the Template
- Historical Data: Contains Jushri Technologies' past financial records and foundational forecasts.
- DCF and Levered DCF Models: Comprehensive templates to assess the intrinsic value of Jushri Technologies (300762SZ).
- WACC Sheet: Pre-configured calculations for the Weighted Average Cost of Capital.
- Editable Inputs: Adjust key metrics such as growth rates, EBITDA percentages, and CAPEX assumptions.
- Quarterly and Annual Statements: An exhaustive overview of Jushri Technologies' financial data.
- Interactive Dashboard: Dynamic visualizations of valuation outcomes and forecasts.
Disclaimer
All information, articles, and product details provided on this website are for general informational and educational purposes only. We do not claim any ownership over, nor do we intend to infringe upon, any trademarks, copyrights, logos, brand names, or other intellectual property mentioned or depicted on this site. Such intellectual property remains the property of its respective owners, and any references here are made solely for identification or informational purposes, without implying any affiliation, endorsement, or partnership.
We make no representations or warranties, express or implied, regarding the accuracy, completeness, or suitability of any content or products presented. Nothing on this website should be construed as legal, tax, investment, financial, medical, or other professional advice. In addition, no part of this site—including articles or product references—constitutes a solicitation, recommendation, endorsement, advertisement, or offer to buy or sell any securities, franchises, or other financial instruments, particularly in jurisdictions where such activity would be unlawful.
All content is of a general nature and may not address the specific circumstances of any individual or entity. It is not a substitute for professional advice or services. Any actions you take based on the information provided here are strictly at your own risk. You accept full responsibility for any decisions or outcomes arising from your use of this website and agree to release us from any liability in connection with your use of, or reliance upon, the content or products found herein.