
|
Sirio Pharma Co., Ltd. (300791.sz) Valoración de DCF |
Completamente Editable: Adáptelo A Sus Necesidades En Excel O Sheets
Diseño Profesional: Plantillas Confiables Y Estándares De La Industria
Predeterminadas Para Un Uso Rápido Y Eficiente
Compatible con MAC / PC, completamente desbloqueado
No Se Necesita Experiencia; Fáciles De Seguir
Sirio Pharma Co., Ltd. (300791.SZ) Bundle
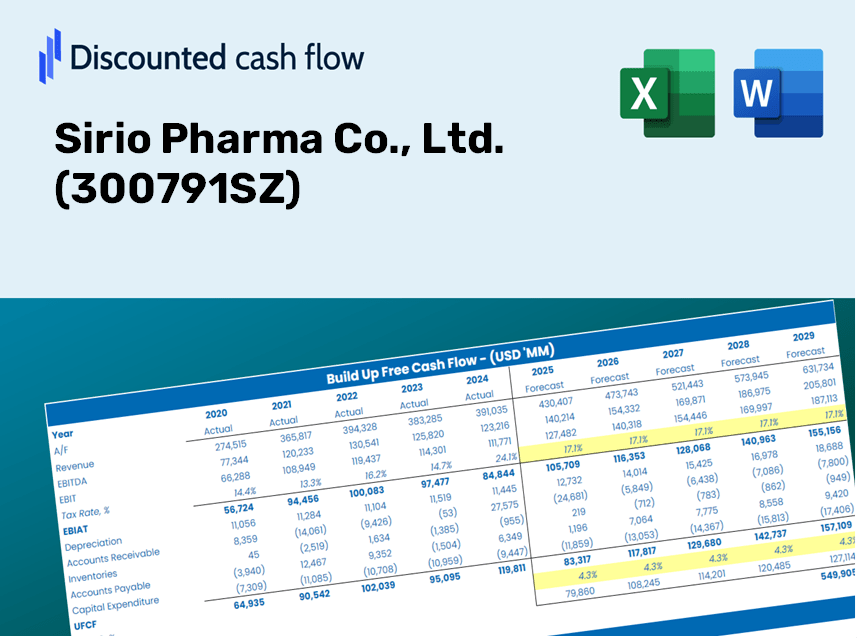
¡Obtenga información sobre su análisis de valoración Sirio Pharma Co., Ltd. (300791SZ) con nuestra sofisticada calculadora DCF! Cargados con datos reales de (300791SZ), esta plantilla de Excel le permite ajustar los pronósticos y supuestos para determinar con precisión el valor intrínseco de Sirio Pharma Co., Ltd.
What You Will Receive
- Adjustable Forecast Parameters: Easily modify assumptions (growth %, profit margins, WACC) to explore various scenarios.
- Real-Time Data: Sirio Pharma’s financial information pre-loaded to enhance your analysis.
- Automatic DCF Calculations: The template provides automatic calculations of Net Present Value (NPV) and intrinsic value.
- Professional and Flexible Design: A refined Excel model tailored to suit your valuation requirements.
- Designed for Analysts and Investors: Perfect for analyzing projections, validating strategies, and improving efficiency.
Key Features
- 🔍 Real-Life Sirio Pharma Financials: Pre-filled historical and projected data for Sirio Pharma Co., Ltd. (300791SZ).
- ✏️ Fully Customizable Inputs: Adjust all key parameters (yellow cells) such as WACC, growth %, and tax rates.
- 📊 Professional DCF Valuation: Integrated formulas calculate the intrinsic value of Sirio Pharma using the Discounted Cash Flow method.
- ⚡ Instant Results: Visualize Sirio Pharma's valuation immediately after modifications.
- Scenario Analysis: Evaluate and compare results for different financial assumptions side-by-side.
How It Operates
- Step 1: Download the Excel file.
- Step 2: Examine Sirio Pharma Co., Ltd.'s pre-filled financial data and projections.
- Step 3: Adjust key inputs, such as revenue growth, WACC, and tax rates (highlighted cells).
- Step 4: Observe the DCF model refresh in real-time as you modify your assumptions.
- Step 5: Evaluate the results and leverage them for your investment strategies.
Why Opt for Sirio Pharma's Calculator?
- Accurate Financials: Utilize real data from Sirio Pharma to ensure trustworthy valuation outcomes.
- Customizable Settings: Tailor essential parameters such as growth rates, WACC, and tax rates to align with your forecasts.
- Efficiency Boost: Ready-made calculations save you the time of building from the ground up.
- Professional Quality Tool: Crafted for use by investors, analysts, and consultants in the pharmaceutical sector.
- User-Friendly Interface: The intuitive design and guided steps make it accessible for all users.
Who Should Utilize This Product?
- Professional Investors: Develop thorough and trustworthy valuation models for analyzing portfolios associated with Sirio Pharma Co., Ltd. (300791SZ).
- Corporate Finance Teams: Evaluate valuation scenarios to inform internal strategic decisions for Sirio Pharma Co., Ltd. (300791SZ).
- Consultants and Advisors: Deliver precise valuation insights for clients investing in Sirio Pharma Co., Ltd. (300791SZ).
- Students and Educators: Leverage real-world data to practice and instruct on financial modeling related to Sirio Pharma Co., Ltd. (300791SZ).
- Pharmaceutical Enthusiasts: Gain insights into how companies like Sirio Pharma Co., Ltd. (300791SZ) are valued within the market.
What the Template Includes
- Pre-Filled DCF Model: Sirio Pharma’s financial data preloaded for immediate application.
- WACC Calculator: Comprehensive calculations for Weighted Average Cost of Capital.
- Financial Ratios: Assess Sirio Pharma’s profitability, leverage, and operational efficiency.
- Editable Inputs: Adjust assumptions such as growth rates, margins, and CAPEX to suit your scenarios.
- Financial Statements: Annual and quarterly reports to facilitate in-depth analysis.
- Interactive Dashboard: Effortlessly visualize key valuation metrics and outcomes.
Disclaimer
All information, articles, and product details provided on this website are for general informational and educational purposes only. We do not claim any ownership over, nor do we intend to infringe upon, any trademarks, copyrights, logos, brand names, or other intellectual property mentioned or depicted on this site. Such intellectual property remains the property of its respective owners, and any references here are made solely for identification or informational purposes, without implying any affiliation, endorsement, or partnership.
We make no representations or warranties, express or implied, regarding the accuracy, completeness, or suitability of any content or products presented. Nothing on this website should be construed as legal, tax, investment, financial, medical, or other professional advice. In addition, no part of this site—including articles or product references—constitutes a solicitation, recommendation, endorsement, advertisement, or offer to buy or sell any securities, franchises, or other financial instruments, particularly in jurisdictions where such activity would be unlawful.
All content is of a general nature and may not address the specific circumstances of any individual or entity. It is not a substitute for professional advice or services. Any actions you take based on the information provided here are strictly at your own risk. You accept full responsibility for any decisions or outcomes arising from your use of this website and agree to release us from any liability in connection with your use of, or reliance upon, the content or products found herein.