
|
CNGR Advanced Material Co., Ltd. (300919.sz) valoración de DCF |
Completamente Editable: Adáptelo A Sus Necesidades En Excel O Sheets
Diseño Profesional: Plantillas Confiables Y Estándares De La Industria
Predeterminadas Para Un Uso Rápido Y Eficiente
Compatible con MAC / PC, completamente desbloqueado
No Se Necesita Experiencia; Fáciles De Seguir
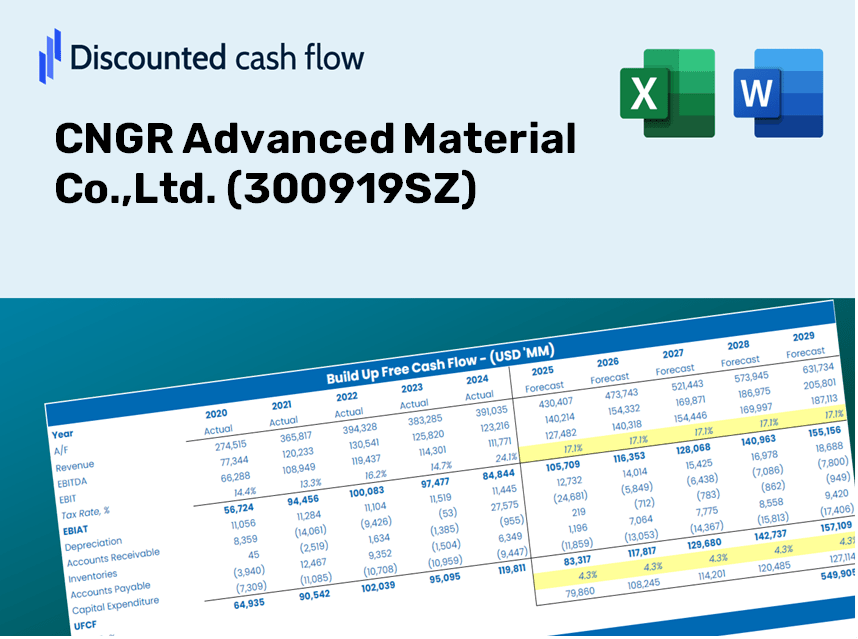
CNGR Advanced Material Co.,Ltd. (300919.SZ) Bundle
¡Streamline CNGR Advanced Material Co., Ltd. (300919SZ) Valoración con esta calculadora DCF personalizable! Con Real CNGR Advanced Material Co., Ltd. (300919SZ) financieras y entradas de pronóstico ajustable, puede explorar diferentes escenarios y determinar CNGR Advanced Material Co., Ltd. (300919SZ) Valor razonable en solo minutos.
Discounted Cash Flow (DCF) - (USD MM)
| Year | AY1 2020 |
AY2 2021 |
AY3 2022 |
AY4 2023 |
AY5 2024 |
FY1 2025 |
FY2 2026 |
FY3 2027 |
FY4 2028 |
FY5 2029 |
|---|---|---|---|---|---|---|---|---|---|---|
| Revenue | 7,439.6 | 20,072.5 | 30,343.7 | 34,273.2 | 40,222.9 | 58,472.0 | 85,000.8 | 123,565.7 | 179,627.6 | 261,124.7 |
| Revenue Growth, % | 0 | 169.81 | 51.17 | 12.95 | 17.36 | 45.37 | 45.37 | 45.37 | 45.37 | 45.37 |
| EBITDA | 635.0 | 1,311.8 | 2,227.5 | 3,473.9 | 4,126.2 | 5,005.8 | 7,277.0 | 10,578.5 | 15,378.0 | 22,355.0 |
| EBITDA, % | 8.53 | 6.54 | 7.34 | 10.14 | 10.26 | 8.56 | 8.56 | 8.56 | 8.56 | 8.56 |
| Depreciation | 153.2 | 229.4 | 499.4 | 851.6 | 1,391.8 | 1,262.1 | 1,834.8 | 2,667.2 | 3,877.3 | 5,636.5 |
| Depreciation, % | 2.06 | 1.14 | 1.65 | 2.48 | 3.46 | 2.16 | 2.16 | 2.16 | 2.16 | 2.16 |
| EBIT | 481.8 | 1,082.4 | 1,728.2 | 2,622.3 | 2,734.4 | 3,743.7 | 5,442.2 | 7,911.3 | 11,500.7 | 16,718.5 |
| EBIT, % | 6.48 | 5.39 | 5.7 | 7.65 | 6.8 | 6.4 | 6.4 | 6.4 | 6.4 | 6.4 |
| Total Cash | 2,712.1 | 8,699.3 | 15,253.1 | 11,561.9 | 13,201.1 | 22,993.2 | 33,425.2 | 48,590.2 | 70,635.6 | 102,683.0 |
| Total Cash, percent | .0 | .0 | .0 | .0 | .0 | .0 | .0 | .0 | .0 | .0 |
| Account Receivables | 2,237.9 | 5,818.4 | 5,077.5 | 5,139.8 | 5,790.2 | 12,301.7 | 17,883.0 | 25,996.5 | 37,791.1 | 54,936.9 |
| Account Receivables, % | 30.08 | 28.99 | 16.73 | 15 | 14.4 | 21.04 | 21.04 | 21.04 | 21.04 | 21.04 |
| Inventories | 1,459.7 | 4,824.4 | 9,620.2 | 7,929.1 | 9,826.4 | 14,375.2 | 20,897.3 | 30,378.4 | 44,161.1 | 64,197.0 |
| Inventories, % | 19.62 | 24.04 | 31.7 | 23.13 | 24.43 | 24.58 | 24.58 | 24.58 | 24.58 | 24.58 |
| Accounts Payable | 3,522.7 | 10,018.2 | 8,722.9 | 3,183.6 | 10,249.4 | 18,802.1 | 27,332.6 | 39,733.4 | 57,760.5 | 83,966.5 |
| Accounts Payable, % | 47.35 | 49.91 | 28.75 | 9.29 | 25.48 | 32.16 | 32.16 | 32.16 | 32.16 | 32.16 |
| Capital Expenditure | -1,046.3 | -4,995.7 | -9,540.9 | -6,936.2 | -6,472.0 | -12,480.6 | -18,143.1 | -26,374.6 | -38,340.7 | -55,736.0 |
| Capital Expenditure, % | -14.06 | -24.89 | -31.44 | -20.24 | -16.09 | -21.34 | -21.34 | -21.34 | -21.34 | -21.34 |
| Tax Rate, % | 27.46 | 27.46 | 27.46 | 27.46 | 27.46 | 27.46 | 27.46 | 27.46 | 27.46 | 27.46 |
| EBITAT | 425.6 | 951.8 | 1,580.3 | 2,144.8 | 1,983.5 | 3,160.1 | 4,593.8 | 6,678.0 | 9,707.8 | 14,112.2 |
| Depreciation | ||||||||||
| Changes in Account Receivables | ||||||||||
| Changes in Inventories | ||||||||||
| Changes in Accounts Payable | ||||||||||
| Capital Expenditure | ||||||||||
| UFCF | -642.3 | -4,264.2 | -12,811.4 | -7,850.4 | 1,421.4 | -10,566.1 | -15,287.3 | -22,223.2 | -32,305.9 | -46,963.0 |
| WACC, % | 7.39 | 7.39 | 7.45 | 7.28 | 7.12 | 7.33 | 7.33 | 7.33 | 7.33 | 7.33 |
| PV UFCF | ||||||||||
| SUM PV UFCF | -98,419.8 | |||||||||
| Long Term Growth Rate, % | 3.50 | |||||||||
| Free cash flow (T + 1) | -48,607 | |||||||||
| Terminal Value | -1,270,536 | |||||||||
| Present Terminal Value | -892,213 | |||||||||
| Enterprise Value | -990,633 | |||||||||
| Net Debt | 9,058 | |||||||||
| Equity Value | -999,691 | |||||||||
| Diluted Shares Outstanding, MM | 928 | |||||||||
| Equity Value Per Share | -1,076.76 |
Benefits You Will Receive
- Authentic CNGR Financial Data: Access both historical and projected figures for precise valuation.
- Customizable Parameters: Adjust WACC, tax rates, growth forecasts, and capital expenditures as needed.
- Dynamic Calculations: Intrinsic value and NPV are computed in real-time.
- Scenario Analysis Tool: Evaluate various scenarios to forecast CNGR's future performance.
- User-Friendly Design: Crafted for experts while remaining approachable for newcomers.
Key Features
- Comprehensive Data Set: CNGR Advanced Material Co., Ltd.'s historical financial records and pre-populated forecasts.
- Customizable Inputs: Adjust parameters such as WACC, tax rates, revenue growth, and EBITDA margins as needed.
- Real-Time Insights: Monitor the recalculation of CNGR's intrinsic value instantly.
- Intuitive Visualizations: Interactive dashboard charts present valuation findings and essential metrics.
- Designed for Precision: A robust tool tailored for analysts, investors, and finance professionals.
How It Functions
- Step 1: Download the Excel spreadsheet.
- Step 2: Review CNGR Advanced Material Co., Ltd.'s pre-filled financial data and projections.
- Step 3: Adjust key inputs such as revenue growth, WACC, and tax rates (highlighted cells).
- Step 4: Watch the DCF model update dynamically as you modify assumptions.
- Step 5: Analyze the results and utilize the insights for investment decisions.
Why Choose This Calculator for CNGR Advanced Material Co.,Ltd. (300919SZ)?
- Designed for Experts: A sophisticated tool tailored for analysts, CFOs, and industry consultants.
- Accurate Data: Features CNGR's historical and projected financials for precise analysis.
- Flexible Scenario Analysis: Easily model various forecasts and assumptions.
- Comprehensive Outputs: Instantly computes intrinsic value, NPV, and other essential metrics.
- User-Friendly: Step-by-step guidance ensures a seamless experience.
Who Can Benefit from This Product?
- Engineering Students: Explore material science principles and apply them to real-world data.
- Researchers: Integrate cutting-edge models into your academic studies or projects.
- Investors: Validate your investment strategies by analyzing the performance metrics of CNGR Advanced Material Co., Ltd. (300919SZ).
- Market Analysts: Enhance your analysis process with a customizable financial model tailored for CNGR Advanced Material Co., Ltd.
- Entrepreneurs: Understand the methodologies behind evaluating growth in companies like CNGR Advanced Material Co., Ltd. (300919SZ).
Contents of the Template
- Pre-Filled Data: Contains CNGR Advanced Material Co., Ltd.'s historical financial figures and forecasts.
- Discounted Cash Flow Model: Editable DCF valuation model featuring automatic calculations.
- Weighted Average Cost of Capital (WACC): A dedicated sheet for WACC calculation utilizing custom inputs.
- Key Financial Ratios: Assess CNGR's profitability, efficiency, and leverage metrics.
- Customizable Inputs: Easily adjust revenue growth, margins, and tax rates.
- Clear Dashboard: Visual summaries through charts and tables displaying key valuation outcomes.
Disclaimer
All information, articles, and product details provided on this website are for general informational and educational purposes only. We do not claim any ownership over, nor do we intend to infringe upon, any trademarks, copyrights, logos, brand names, or other intellectual property mentioned or depicted on this site. Such intellectual property remains the property of its respective owners, and any references here are made solely for identification or informational purposes, without implying any affiliation, endorsement, or partnership.
We make no representations or warranties, express or implied, regarding the accuracy, completeness, or suitability of any content or products presented. Nothing on this website should be construed as legal, tax, investment, financial, medical, or other professional advice. In addition, no part of this site—including articles or product references—constitutes a solicitation, recommendation, endorsement, advertisement, or offer to buy or sell any securities, franchises, or other financial instruments, particularly in jurisdictions where such activity would be unlawful.
All content is of a general nature and may not address the specific circumstances of any individual or entity. It is not a substitute for professional advice or services. Any actions you take based on the information provided here are strictly at your own risk. You accept full responsibility for any decisions or outcomes arising from your use of this website and agree to release us from any liability in connection with your use of, or reliance upon, the content or products found herein.