
|
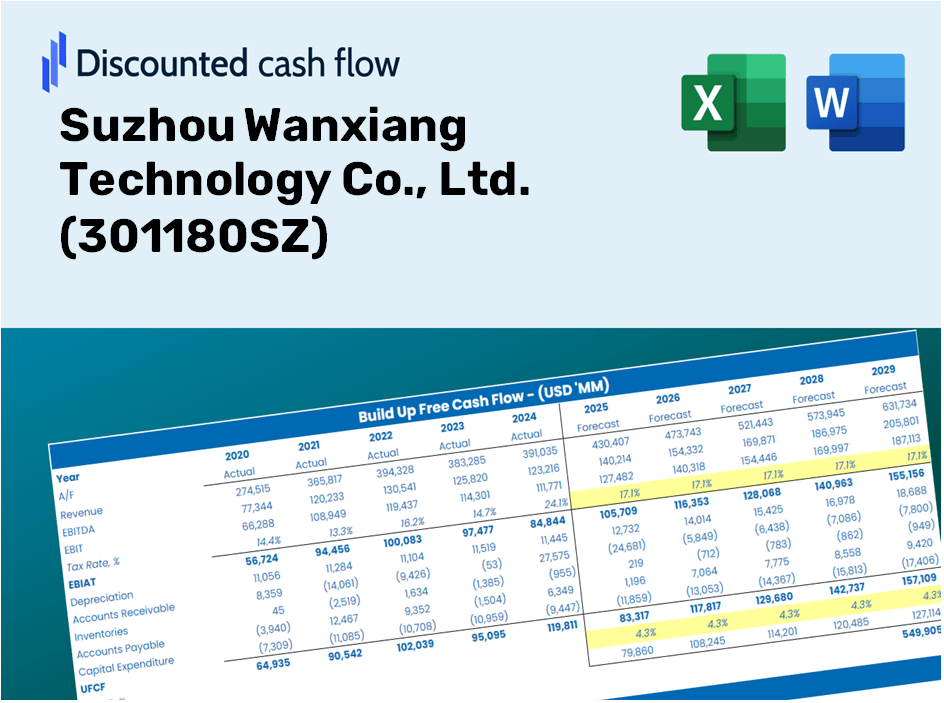
Suzhou Wanxiang Technology Co., Ltd. (301180.sz) Valoración de DCF |
Completamente Editable: Adáptelo A Sus Necesidades En Excel O Sheets
Diseño Profesional: Plantillas Confiables Y Estándares De La Industria
Predeterminadas Para Un Uso Rápido Y Eficiente
Compatible con MAC / PC, completamente desbloqueado
No Se Necesita Experiencia; Fáciles De Seguir
Suzhou Wanxiang Technology Co., Ltd. (301180.SZ) Bundle
Como inversor o analista, la calculadora DCF para Suzhou Wanxiang Technology Co., Ltd. (301180SZ) es un recurso esencial para una valoración precisa. Con datos reales de [Compañía], puede ajustar fácilmente los pronósticos y observar los efectos inmediatos.
Benefits of Choosing Us
- Authentic 301180 Financial Data: Access comprehensive historical and projected data for Suzhou Wanxiang Technology Co., Ltd. for accurate analysis.
- Customizable Template: Easily adjust essential inputs such as revenue growth, WACC, and EBITDA % to fit your needs.
- Real-Time Calculations: Instantly view updates to Suzhou Wanxiang's intrinsic value as you make adjustments.
- Professional Valuation Tool: Tailored for investors, analysts, and consultants aiming for reliable DCF outcomes.
- User-Friendly Interface: Designed with a straightforward layout and clear guidance suitable for all experience levels.
Key Features
- Comprehensive DCF Calculator: Features both unlevered and levered DCF valuation models tailored for Suzhou Wanxiang Technology Co., Ltd. (301180SZ).
- WACC Calculator: User-friendly Weighted Average Cost of Capital sheet with adjustable parameters.
- Customizable Forecast Inputs: Easily change growth projections, capital investments, and discount rates.
- Integrated Financial Ratios: Evaluate profitability, leverage, and efficiency ratios specific to Suzhou Wanxiang Technology Co., Ltd. (301180SZ).
- Interactive Dashboard and Charts: Visual representations provide a clear overview of essential valuation metrics for straightforward analysis.
How It Operates
- 1. Access the Template: Download and open the Excel file containing Suzhou Wanxiang Technology Co., Ltd.'s preloaded data.
- 2. Modify Assumptions: Adjust essential input variables such as growth rates, WACC, and capital expenditures.
- 3. View Results Instantly: The DCF model will automatically calculate the intrinsic value and NPV for you.
- 4. Evaluate Scenarios: Analyze multiple forecasts to explore various valuation possibilities.
- 5. Present with Confidence: Share professional valuation insights to substantiate your decision-making.
Why Opt for This Calculator?
- Designed for Experts: A sophisticated tool utilized by analysts, CFOs, and consultants.
- Accurate Data: Suzhou Wanxiang Technology Co., Ltd.'s historical and projected financials are preloaded for precision.
- Versatile Scenario Analysis: Effortlessly simulate various forecasts and assumptions.
- Comprehensive Outputs: Automatically calculates intrinsic value, NPV, and essential metrics.
- User-Friendly: Step-by-step guidance makes it easy to navigate the process.
Who Can Benefit from Our Services?
- Individual Investors: Gain insights to make informed decisions regarding investments in Suzhou Wanxiang Technology Co., Ltd. (301180SZ).
- Financial Analysts: Enhance valuation processes utilizing our comprehensive financial models tailored for (301180SZ).
- Consultants: Provide clients with accurate valuation analyses and insights on Suzhou Wanxiang Technology Co., Ltd. (301180SZ) efficiently.
- Business Owners: Learn how large enterprises like Suzhou Wanxiang Technology Co., Ltd. (301180SZ) are valued to inform your own business strategies.
- Finance Students: Explore valuation techniques through practical applications and data related to (301180SZ).
What the Template Includes
- Preloaded 301180SZ Data: Historical and forecasted financial figures such as revenue, EBIT, and capital expenditures.
- DCF and WACC Models: Professional-quality spreadsheets for assessing intrinsic value and calculating the Weighted Average Cost of Capital.
- Editable Inputs: Yellow-highlighted cells for modifying revenue growth, tax rates, and discount rates.
- Financial Statements: Detailed annual and quarterly financial reports for in-depth analysis.
- Key Ratios: Ratios measuring profitability, leverage, and efficiency to assess company performance.
- Dashboard and Charts: Visual representations of valuation results and underlying assumptions.
Disclaimer
All information, articles, and product details provided on this website are for general informational and educational purposes only. We do not claim any ownership over, nor do we intend to infringe upon, any trademarks, copyrights, logos, brand names, or other intellectual property mentioned or depicted on this site. Such intellectual property remains the property of its respective owners, and any references here are made solely for identification or informational purposes, without implying any affiliation, endorsement, or partnership.
We make no representations or warranties, express or implied, regarding the accuracy, completeness, or suitability of any content or products presented. Nothing on this website should be construed as legal, tax, investment, financial, medical, or other professional advice. In addition, no part of this site—including articles or product references—constitutes a solicitation, recommendation, endorsement, advertisement, or offer to buy or sell any securities, franchises, or other financial instruments, particularly in jurisdictions where such activity would be unlawful.
All content is of a general nature and may not address the specific circumstances of any individual or entity. It is not a substitute for professional advice or services. Any actions you take based on the information provided here are strictly at your own risk. You accept full responsibility for any decisions or outcomes arising from your use of this website and agree to release us from any liability in connection with your use of, or reliance upon, the content or products found herein.