
|
Shenzhen Han's CNC Technology Co., Ltd. (301200.SZ) Valoración de DCF |
Completamente Editable: Adáptelo A Sus Necesidades En Excel O Sheets
Diseño Profesional: Plantillas Confiables Y Estándares De La Industria
Predeterminadas Para Un Uso Rápido Y Eficiente
Compatible con MAC / PC, completamente desbloqueado
No Se Necesita Experiencia; Fáciles De Seguir
Shenzhen Han's CNC Technology Co., Ltd. (301200.SZ) Bundle
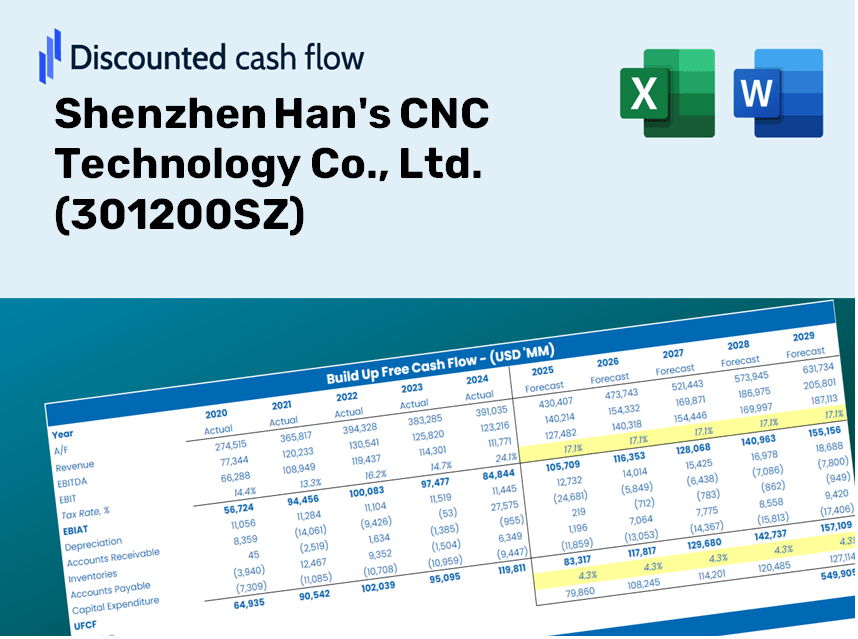
¡Obtenga información sobre su análisis de valoración de Shenzhen Han's CNC Technology Co., Ltd. (301200SZ) con nuestra sofisticada calculadora DCF! Antes de datos reales (301200SZ), esta plantilla de Excel le permite ajustar los pronósticos y supuestos para un cálculo preciso del valor intrínseco de Shenzhen Han.
What You Will Receive
- Authentic Shenzhen Han's Data: Loaded financial metrics – from revenue to EBIT – derived from real and projected statistics.
- Complete Customization: Modify all essential parameters (yellow cells) such as WACC, growth %, and tax rates.
- Immediate Valuation Adjustments: Automatic recalculations to evaluate the effects of changes on Shenzhen Han's fair value.
- Flexible Excel Template: Designed for easy edits, scenario analysis, and comprehensive forecasting.
- Efficiency and Accuracy: Avoid starting models from scratch while ensuring precision and adaptability.
Key Features
- Customizable Forecast Inputs: Adjust vital parameters such as revenue growth, EBITDA %, and capital expenditures.
- Instant DCF Valuation: Quickly computes intrinsic value, NPV, and other financial metrics.
- Industry-Leading Precision: Utilizes Shenzhen Han's CNC Technology's real-world financials for accurate valuation results.
- Simplified Scenario Analysis: Effortlessly test various assumptions and evaluate different outcomes.
- Efficiency Booster: Skip the complexities of building valuation models from the ground up.
How It Works
- Download: Obtain the pre-prepared Excel file containing Shenzhen Han's CNC Technology Co., Ltd.'s financial data.
- Customize: Modify forecasts, such as revenue growth, EBITDA %, and WACC.
- Update Automatically: The intrinsic value and NPV calculations refresh in real-time.
- Test Scenarios: Generate various projections and instantly compare the results.
- Make Decisions: Utilize the valuation findings to inform your investment approach.
Why Opt for This Solution?
- Designed for Experts: A sophisticated tool favored by engineers, managers, and industry consultants.
- Accurate Data: Comprehensive access to Shenzhen Han's CNC Technology Co., Ltd.'s [Symbol] historical and projected performance metrics.
- Scenario Analysis: Effortlessly model various projections and assumptions.
- Transparent Results: Instantly calculates critical metrics such as ROI, efficiency ratios, and intrinsic value.
- User-Friendly: Step-by-step guidance ensures a smooth experience.
Who Should Utilize This Product?
- Professional Investors: Develop in-depth and trustworthy valuation models for portfolio assessment of Shenzhen Han's CNC Technology Co., Ltd. (301200SZ).
- Corporate Finance Teams: Evaluate valuation scenarios to influence strategic decisions within their organizations.
- Consultants and Advisors: Deliver precise valuation insights to clients interested in Shenzhen Han's CNC Technology Co., Ltd. (301200SZ).
- Students and Educators: Leverage real-world data for hands-on practice and teaching in financial modeling.
- Tech Enthusiasts: Gain insights into the market valuation of technology firms like Shenzhen Han's CNC Technology Co., Ltd. (301200SZ).
Contents of the Template
- In-Depth DCF Model: Editable framework featuring comprehensive valuation computations.
- Actual Data: Shenzhen Han's CNC Technology Co., Ltd.’s (301200SZ) historical and projected financial metrics preloaded for thorough analysis.
- Adjustable Parameters: Customize WACC, growth rates, and tax assumptions to explore different scenarios.
- Financial Statements: Complete annual and quarterly breakdowns for enhanced insights.
- Critical Ratios: Embedded analysis covering profitability, efficiency, and leverage metrics.
- Visual Dashboard: Charts and tables that provide clear and actionable insights.
Disclaimer
All information, articles, and product details provided on this website are for general informational and educational purposes only. We do not claim any ownership over, nor do we intend to infringe upon, any trademarks, copyrights, logos, brand names, or other intellectual property mentioned or depicted on this site. Such intellectual property remains the property of its respective owners, and any references here are made solely for identification or informational purposes, without implying any affiliation, endorsement, or partnership.
We make no representations or warranties, express or implied, regarding the accuracy, completeness, or suitability of any content or products presented. Nothing on this website should be construed as legal, tax, investment, financial, medical, or other professional advice. In addition, no part of this site—including articles or product references—constitutes a solicitation, recommendation, endorsement, advertisement, or offer to buy or sell any securities, franchises, or other financial instruments, particularly in jurisdictions where such activity would be unlawful.
All content is of a general nature and may not address the specific circumstances of any individual or entity. It is not a substitute for professional advice or services. Any actions you take based on the information provided here are strictly at your own risk. You accept full responsibility for any decisions or outcomes arising from your use of this website and agree to release us from any liability in connection with your use of, or reliance upon, the content or products found herein.