
|
Shandong Sanyuan Biotechnology Co., Ltd. (301206.sz) Valoración de DCF |
Completamente Editable: Adáptelo A Sus Necesidades En Excel O Sheets
Diseño Profesional: Plantillas Confiables Y Estándares De La Industria
Predeterminadas Para Un Uso Rápido Y Eficiente
Compatible con MAC / PC, completamente desbloqueado
No Se Necesita Experiencia; Fáciles De Seguir
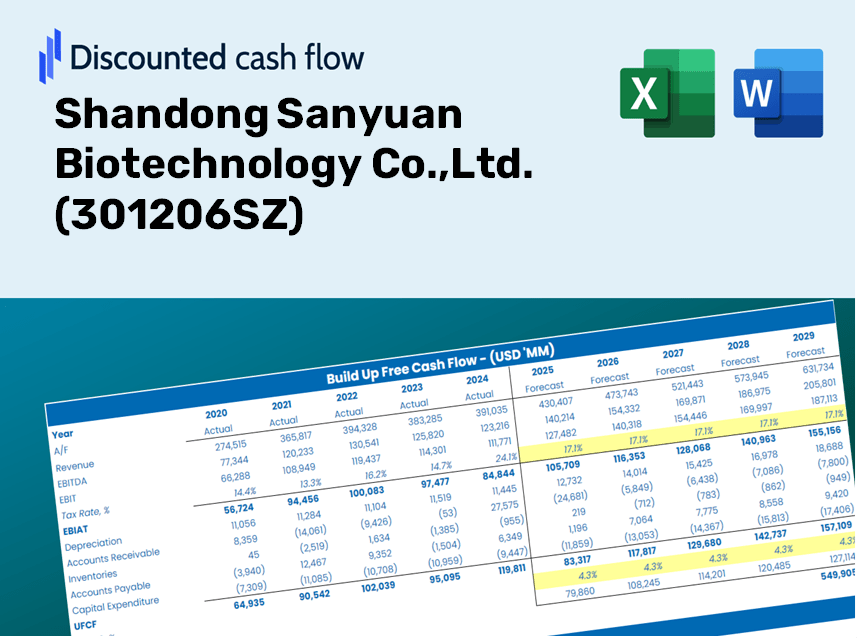
Shandong Sanyuan Biotechnology Co.,Ltd. (301206.SZ) Bundle
¡Explore las perspectivas financieras de Shandong Sanyuan Biotechnology Co., Ltd. con nuestra calculadora DCF fácil de usar! Ingrese sus predicciones para el crecimiento, los márgenes y los costos para calcular el valor intrínseco de Shandong Sanyuan Biotechnology Co., Ltd. y mejorar su estrategia de inversión basada en [símbolo] (301206SZ).
Benefits You Will Receive
- Customizable Excel Template: A DCF Calculator in Excel that you can tailor, featuring pre-filled financial data for Shandong Sanyuan Biotechnology Co., Ltd. (301206SZ).
- Accurate Data: Access to historical figures and projected estimates, highlighted in the yellow cells.
- Adjustable Projections: Modify key assumptions such as revenue growth, EBITDA margins, and WACC at your discretion.
- Instant Calculations: Observe the immediate effects of your inputs on the valuation of Shandong Sanyuan Biotechnology Co., Ltd. (301206SZ).
- Professional Resource: Designed for investors, CFOs, consultants, and financial analysts.
- Intuitive Layout: Organized for straightforward understanding and ease of use, complete with step-by-step guidance.
Key Features
- Pre-Loaded Data: Shandong Sanyuan Biotechnology Co., Ltd.'s historical financial statements and pre-filled forecasts.
- Fully Adjustable Inputs: Customize WACC, tax rates, revenue growth, and EBITDA margins as needed.
- Instant Results: Watch Shandong Sanyuan's intrinsic value recalculate in real time.
- Clear Visual Outputs: Dashboard charts illustrate valuation results and critical metrics.
- Built for Accuracy: A professional-grade tool designed for analysts, investors, and finance experts.
How It Works
- Download: Get the ready-to-use Excel file containing Shandong Sanyuan Biotechnology Co., Ltd.'s financial data.
- Customize: Modify forecasts, such as revenue growth, EBITDA %, and WACC.
- Update Automatically: The intrinsic value and NPV calculations refresh in real-time.
- Test Scenarios: Generate multiple projections and compare results instantly.
- Make Decisions: Use the valuation outcomes to inform your investment strategy for (301206SZ).
Why Choose This Calculator for Shandong Sanyuan Biotechnology Co., Ltd. (301206SZ)?
- User-Friendly Interface: Perfectly suited for both beginners and seasoned professionals.
- Customizable Parameters: Adjust inputs effortlessly to align with your analysis needs.
- Real-Time Updates: Instantly view changes in valuation for Shandong Sanyuan as you modify your inputs.
- Pre-Loaded Data: Comes with Shandong Sanyuan's latest financial information for quick evaluations.
- Widely Used by Experts: Favored by investors and analysts for making informed choices.
Who Should Use This Product?
- Investors: Evaluate Shandong Sanyuan Biotechnology Co., Ltd.'s (301206SZ) fair value to inform your investment choices.
- CFOs: Utilize a high-quality DCF model for financial analysis and reporting needs.
- Consultants: Efficiently customize the template for client valuation reports.
- Entrepreneurs: Discover financial modeling insights utilized by leading companies.
- Educators: Employ it as an educational resource to illustrate valuation techniques.
Contents of the Template
- Pre-Populated Data: Contains Shandong Sanyuan Biotechnology Co.,Ltd.'s historical financials and forecasts.
- Discounted Cash Flow Model: An editable DCF valuation model with automated calculations.
- Weighted Average Cost of Capital (WACC): A dedicated sheet to calculate WACC using user-defined inputs.
- Essential Financial Ratios: Assess Shandong Sanyuan's profitability, efficiency, and leverage metrics.
- Customizable Inputs: Easily modify revenue growth, margins, and tax rates.
- User-Friendly Dashboard: Visual representations and tables summarizing key valuation outputs.
Disclaimer
All information, articles, and product details provided on this website are for general informational and educational purposes only. We do not claim any ownership over, nor do we intend to infringe upon, any trademarks, copyrights, logos, brand names, or other intellectual property mentioned or depicted on this site. Such intellectual property remains the property of its respective owners, and any references here are made solely for identification or informational purposes, without implying any affiliation, endorsement, or partnership.
We make no representations or warranties, express or implied, regarding the accuracy, completeness, or suitability of any content or products presented. Nothing on this website should be construed as legal, tax, investment, financial, medical, or other professional advice. In addition, no part of this site—including articles or product references—constitutes a solicitation, recommendation, endorsement, advertisement, or offer to buy or sell any securities, franchises, or other financial instruments, particularly in jurisdictions where such activity would be unlawful.
All content is of a general nature and may not address the specific circumstances of any individual or entity. It is not a substitute for professional advice or services. Any actions you take based on the information provided here are strictly at your own risk. You accept full responsibility for any decisions or outcomes arising from your use of this website and agree to release us from any liability in connection with your use of, or reliance upon, the content or products found herein.