
|
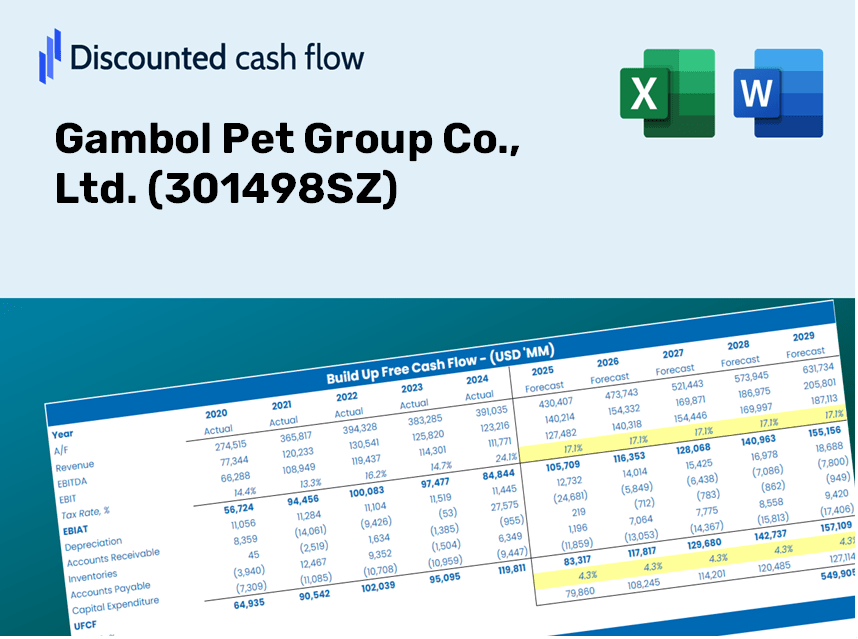
Gambol Pet Group Co., Ltd. (301498.SZ) Valoración de DCF |
Completamente Editable: Adáptelo A Sus Necesidades En Excel O Sheets
Diseño Profesional: Plantillas Confiables Y Estándares De La Industria
Predeterminadas Para Un Uso Rápido Y Eficiente
Compatible con MAC / PC, completamente desbloqueado
No Se Necesita Experiencia; Fáciles De Seguir
Gambol Pet Group Co., Ltd. (301498.SZ) Bundle
Diseñada para la precisión, nuestra calculadora DCF (301498SZ) le permite evaluar Gambol Pet Group Co., Ltd. Valoración utilizando datos financieros del mundo real, ofreciendo una flexibilidad completa para modificar todos los parámetros clave para las proyecciones mejoradas.
Benefits You Will Receive
- Customizable Excel Template: A fully adaptable Excel-based DCF Calculator featuring pre-filled financial data for Gambol Pet Group Co., Ltd. (301498SZ).
- Actual Market Data: Access to historical performance data and forward-looking projections (highlighted in the yellow cells).
- Flexible Forecasting: Modify key assumptions such as revenue growth, EBITDA margin, and WACC as needed.
- Instant Calculations: Quickly observe how your inputs influence the valuation of Gambol Pet Group Co., Ltd. (301498SZ).
- Professional-Grade Tool: Designed for investors, CFOs, consultants, and financial analysts.
- User-Friendly Layout: Organized for simplicity and efficiency, complete with step-by-step guidance.
Key Features
- Real Gambol Financials: Gain access to accurate, pre-loaded historical data and future forecasts for Gambol Pet Group Co., Ltd. (301498SZ).
- Customizable Forecast Parameters: Adjust highlighted cells such as WACC, growth rates, and profit margins to fit your analysis.
- Dynamic Calculations: Real-time updates for DCF, Net Present Value (NPV), and cash flow assessments.
- Visual Dashboard: User-friendly charts and summaries that simplify the visualization of your valuation outcomes.
- Suitable for All Skill Levels: An intuitive design tailored for investors, CFOs, and consultants, whether you're a novice or a professional.
How It Works
- Step 1: Download the prebuilt Excel template that includes data for Gambol Pet Group Co., Ltd. (301498SZ).
- Step 2: Navigate through the pre-filled sheets to familiarize yourself with the key performance indicators.
- Step 3: Modify forecasts and assumptions in the editable yellow cells (WACC, growth rates, profit margins).
- Step 4: Instantly view the updated results, including the intrinsic value of Gambol Pet Group Co., Ltd. (301498SZ).
- Step 5: Use the generated outputs to make well-informed investment decisions or create detailed reports.
Why Opt for the Gambol Pet Group Calculator?
- All-in-One Solution: Features DCF, WACC, and financial ratio analyses bundled together.
- Adjustable Parameters: Modify the yellow-highlighted cells to explore different scenarios.
- In-Depth Analysis: Automatically computes the intrinsic value and Net Present Value for Gambol Pet Group (301498SZ).
- Data Ready: Includes both historical and projected data for a solid foundation.
- High-Quality Standard: Perfectly suited for financial analysts, investors, and business advisors.
Who Can Benefit from Gambol Pet Group Co., Ltd. (301498SZ)?
- Pet Industry Investors: Develop comprehensive and accurate valuation models for analyzing investment opportunities.
- Corporate Finance Teams: Evaluate different valuation scenarios to inform strategic decisions within the company.
- Consultants and Advisors: Deliver precise valuation insights to clients interested in the pet industry and Gambol Pet Group (301498SZ).
- Students and Educators: Utilize real-world data to enhance learning and practice in financial modeling related to the pet sector.
- Pet Enthusiasts: Gain insight into how companies like Gambol Pet Group (301498SZ) are appraised in the market.
Overview of What the Template Includes
- Historical Data: Provides Gambol Pet Group Co., Ltd.'s past financial performance and foundational forecasts.
- DCF and Levered DCF Models: Comprehensive templates for assessing the intrinsic value of Gambol Pet Group Co., Ltd. (301498SZ).
- WACC Sheet: Ready-made calculations for the Weighted Average Cost of Capital.
- Editable Inputs: Customize essential drivers such as growth rates, EBITDA percentages, and CAPEX projections.
- Quarterly and Annual Statements: An in-depth analysis of Gambol Pet Group Co., Ltd.'s financial data.
- Interactive Dashboard: Dynamically visualize valuation outcomes and future projections.
Disclaimer
All information, articles, and product details provided on this website are for general informational and educational purposes only. We do not claim any ownership over, nor do we intend to infringe upon, any trademarks, copyrights, logos, brand names, or other intellectual property mentioned or depicted on this site. Such intellectual property remains the property of its respective owners, and any references here are made solely for identification or informational purposes, without implying any affiliation, endorsement, or partnership.
We make no representations or warranties, express or implied, regarding the accuracy, completeness, or suitability of any content or products presented. Nothing on this website should be construed as legal, tax, investment, financial, medical, or other professional advice. In addition, no part of this site—including articles or product references—constitutes a solicitation, recommendation, endorsement, advertisement, or offer to buy or sell any securities, franchises, or other financial instruments, particularly in jurisdictions where such activity would be unlawful.
All content is of a general nature and may not address the specific circumstances of any individual or entity. It is not a substitute for professional advice or services. Any actions you take based on the information provided here are strictly at your own risk. You accept full responsibility for any decisions or outcomes arising from your use of this website and agree to release us from any liability in connection with your use of, or reliance upon, the content or products found herein.