
|
Nisshinbo Holdings Inc. (3105.T) Valoración de DCF |
Completamente Editable: Adáptelo A Sus Necesidades En Excel O Sheets
Diseño Profesional: Plantillas Confiables Y Estándares De La Industria
Predeterminadas Para Un Uso Rápido Y Eficiente
Compatible con MAC / PC, completamente desbloqueado
No Se Necesita Experiencia; Fáciles De Seguir
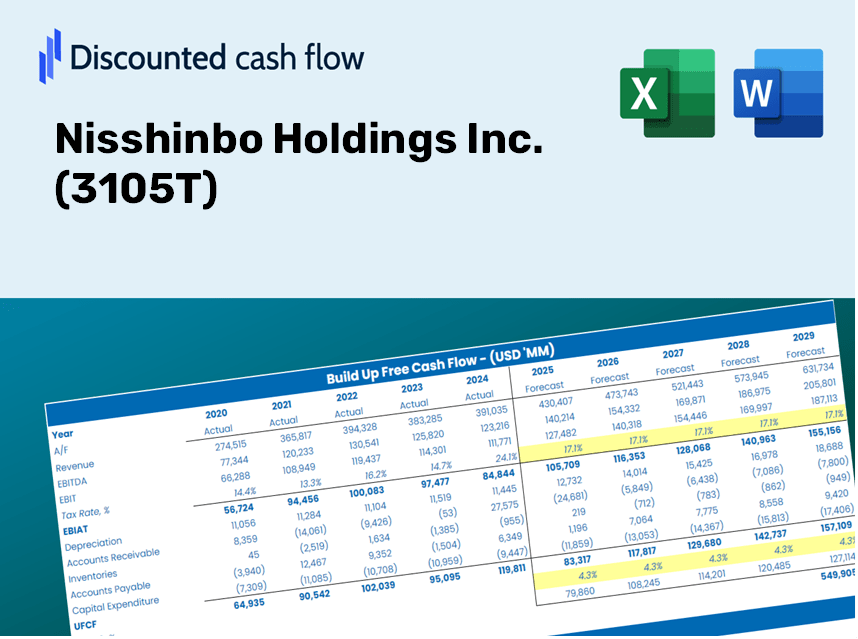
Nisshinbo Holdings Inc. (3105.T) Bundle
¡Evalúe el perspectivo financiero de Nisshinbo Holdings Inc. como un experto! Esta calculadora DCF (3105T) viene con datos financieros previamente llenos y ofrece una flexibilidad total para modificar el crecimiento de los ingresos, WACC, los márgenes de ganancias y otros supuestos esenciales para alinearse con sus proyecciones.
Discounted Cash Flow (DCF) - (USD MM)
| Year | AY1 2020 |
AY2 2021 |
AY3 2022 |
AY4 2023 |
AY5 2024 |
FY1 2025 |
FY2 2026 |
FY3 2027 |
FY4 2028 |
FY5 2029 |
|---|---|---|---|---|---|---|---|---|---|---|
| Revenue | 457,051.0 | 510,643.0 | 516,085.0 | 541,211.0 | 494,746.0 | 505,970.0 | 517,448.6 | 529,187.5 | 541,192.9 | 553,470.5 |
| Revenue Growth, % | 0 | 11.73 | 1.07 | 4.87 | -8.59 | 2.27 | 2.27 | 2.27 | 2.27 | 2.27 |
| EBITDA | 45,123.0 | 48,539.0 | 54,647.0 | 8,932.0 | 52,805.0 | 42,795.3 | 43,766.2 | 44,759.1 | 45,774.5 | 46,813.0 |
| EBITDA, % | 9.87 | 9.51 | 10.59 | 1.65 | 10.67 | 8.46 | 8.46 | 8.46 | 8.46 | 8.46 |
| Depreciation | 23,956.0 | 24,499.0 | 27,209.0 | 26,208.0 | 26,341.0 | 25,782.1 | 26,367.0 | 26,965.2 | 27,576.9 | 28,202.6 |
| Depreciation, % | 5.24 | 4.8 | 5.27 | 4.84 | 5.32 | 5.1 | 5.1 | 5.1 | 5.1 | 5.1 |
| EBIT | 21,167.0 | 24,040.0 | 27,438.0 | -17,276.0 | 26,464.0 | 17,013.2 | 17,399.2 | 17,793.9 | 18,197.6 | 18,610.4 |
| EBIT, % | 4.63 | 4.71 | 5.32 | -3.19 | 5.35 | 3.36 | 3.36 | 3.36 | 3.36 | 3.36 |
| Total Cash | 50,547.0 | 44,940.0 | 45,172.0 | 52,502.0 | 50,411.0 | 49,082.1 | 50,195.6 | 51,334.3 | 52,498.9 | 53,689.9 |
| Total Cash, percent | .0 | .0 | .0 | .0 | .0 | .0 | .0 | .0 | .0 | .0 |
| Account Receivables | 114,602.0 | 121,647.0 | 118,314.0 | 129,955.0 | 145,030.0 | 126,642.0 | 129,515.1 | 132,453.3 | 135,458.1 | 138,531.2 |
| Account Receivables, % | 25.07 | 23.82 | 22.93 | 24.01 | 29.31 | 25.03 | 25.03 | 25.03 | 25.03 | 25.03 |
| Inventories | 116,344.0 | 122,840.0 | 149,401.0 | 169,903.0 | 162,827.0 | 144,469.2 | 147,746.6 | 151,098.5 | 154,526.3 | 158,032.0 |
| Inventories, % | 25.46 | 24.06 | 28.95 | 31.39 | 32.91 | 28.55 | 28.55 | 28.55 | 28.55 | 28.55 |
| Accounts Payable | 39,636.0 | 44,606.0 | 46,880.0 | 40,549.0 | 38,274.0 | 42,217.6 | 43,175.4 | 44,154.9 | 45,156.6 | 46,181.0 |
| Accounts Payable, % | 8.67 | 8.74 | 9.08 | 7.49 | 7.74 | 8.34 | 8.34 | 8.34 | 8.34 | 8.34 |
| Capital Expenditure | -24,601.0 | -20,111.0 | -22,399.0 | -25,291.0 | -24,848.0 | -23,635.4 | -24,171.6 | -24,719.9 | -25,280.8 | -25,854.3 |
| Capital Expenditure, % | -5.38 | -3.94 | -4.34 | -4.67 | -5.02 | -4.67 | -4.67 | -4.67 | -4.67 | -4.67 |
| Tax Rate, % | 57.03 | 57.03 | 57.03 | 57.03 | 57.03 | 57.03 | 57.03 | 57.03 | 57.03 | 57.03 |
| EBITAT | 14,308.6 | 26,055.9 | 21,027.5 | -15,816.3 | 11,370.5 | 12,887.6 | 13,179.9 | 13,478.9 | 13,784.7 | 14,097.4 |
| Depreciation | ||||||||||
| Changes in Account Receivables | ||||||||||
| Changes in Inventories | ||||||||||
| Changes in Accounts Payable | ||||||||||
| Capital Expenditure | ||||||||||
| UFCF | -177,646.4 | 21,872.9 | 4,883.5 | -53,373.3 | 2,589.5 | 55,723.8 | 10,182.6 | 10,413.6 | 10,649.9 | 10,891.5 |
| WACC, % | 3.66 | 4.29 | 3.84 | 4.13 | 3.18 | 3.82 | 3.82 | 3.82 | 3.82 | 3.82 |
| PV UFCF | ||||||||||
| SUM PV UFCF | 90,622.3 | |||||||||
| Long Term Growth Rate, % | 2.70 | |||||||||
| Free cash flow (T + 1) | 11,186 | |||||||||
| Terminal Value | 998,271 | |||||||||
| Present Terminal Value | 827,624 | |||||||||
| Enterprise Value | 918,246 | |||||||||
| Net Debt | 166,774 | |||||||||
| Equity Value | 751,472 | |||||||||
| Diluted Shares Outstanding, MM | 157 | |||||||||
| Equity Value Per Share | 4,781.94 |
What You Will Receive
- Authentic Nisshinbo Financials: Access to both historical and projected data for precise valuation.
- Customizable Parameters: Adjust WACC, tax rates, revenue growth, and capital expenditures as needed.
- Real-Time Calculations: Intrinsic value and NPV are computed automatically.
- Scenario Simulation: Evaluate various scenarios to assess Nisshinbo's future performance.
- User-Friendly Interface: Designed for experts while remaining approachable for newcomers.
Core Features
- 🔍 Real-Time Nisshinbo Financials: Pre-filled historical and projected data for Nisshinbo Holdings Inc. (3105T).
- ✏️ Fully Adjustable Inputs: Modify all essential parameters (yellow cells) such as WACC, growth %, and tax rates.
- 📊 Comprehensive DCF Valuation: Integrated formulas calculate the intrinsic value of Nisshinbo using the Discounted Cash Flow approach.
- ⚡ Immediate Results: View Nisshinbo’s valuation instantly after adjustments.
- Scenario Testing: Analyze and compare results for different financial assumptions side-by-side.
How It Operates
- Download: Obtain the pre-formatted Excel file containing Nisshinbo Holdings Inc.'s financial data.
- Customize: Modify forecasts, such as revenue growth, EBITDA percentage, and WACC.
- Update Automatically: The intrinsic value and NPV calculations refresh in real-time.
- Test Scenarios: Generate multiple projections and compare results immediately.
- Make Decisions: Leverage the valuation outcomes to shape your investment strategy for (3105T).
Why Choose This Calculator for Nisshinbo Holdings Inc. (3105T)?
- User-Friendly Interface: Perfect for both novices and seasoned professionals.
- Customizable Inputs: Adjust parameters easily to suit your financial analysis needs.
- Real-Time Valuation Updates: Instantly see how changes affect Nisshinbo's valuation.
- Preloaded Financial Data: Comes with Nisshinbo's actual financial information for swift assessments.
- Relied Upon by Experts: Favored by investors and analysts for data-driven decision-making.
Who Can Benefit from This Product?
- Investors: Accurately assess the fair value of Nisshinbo Holdings Inc. (3105T) prior to making investment choices.
- CFOs: Utilize a professional-grade DCF model for in-depth financial reporting and analysis.
- Consultants: Easily customize the template for client valuation reports.
- Entrepreneurs: Acquire insights into the financial modeling practices employed by major corporations.
- Educators: Employ it as an educational resource to illustrate valuation techniques.
Contents of the Template
- Pre-Filled Data: Features Nisshinbo Holdings Inc.'s historical financials and projections.
- Discounted Cash Flow Model: An editable DCF valuation model with automated calculations.
- Weighted Average Cost of Capital (WACC): A dedicated sheet for computing WACC using customized inputs.
- Key Financial Ratios: Evaluate Nisshinbo's profitability, efficiency, and leverage.
- Customizable Inputs: Easily modify revenue growth, margins, and tax rates.
- Clear Dashboard: Visuals and tables summarizing essential valuation outcomes.
Disclaimer
All information, articles, and product details provided on this website are for general informational and educational purposes only. We do not claim any ownership over, nor do we intend to infringe upon, any trademarks, copyrights, logos, brand names, or other intellectual property mentioned or depicted on this site. Such intellectual property remains the property of its respective owners, and any references here are made solely for identification or informational purposes, without implying any affiliation, endorsement, or partnership.
We make no representations or warranties, express or implied, regarding the accuracy, completeness, or suitability of any content or products presented. Nothing on this website should be construed as legal, tax, investment, financial, medical, or other professional advice. In addition, no part of this site—including articles or product references—constitutes a solicitation, recommendation, endorsement, advertisement, or offer to buy or sell any securities, franchises, or other financial instruments, particularly in jurisdictions where such activity would be unlawful.
All content is of a general nature and may not address the specific circumstances of any individual or entity. It is not a substitute for professional advice or services. Any actions you take based on the information provided here are strictly at your own risk. You accept full responsibility for any decisions or outcomes arising from your use of this website and agree to release us from any liability in connection with your use of, or reliance upon, the content or products found herein.