
|
Crear SD Holdings Co., Ltd. (3148.T) Valoración de DCF |
Completamente Editable: Adáptelo A Sus Necesidades En Excel O Sheets
Diseño Profesional: Plantillas Confiables Y Estándares De La Industria
Predeterminadas Para Un Uso Rápido Y Eficiente
Compatible con MAC / PC, completamente desbloqueado
No Se Necesita Experiencia; Fáciles De Seguir
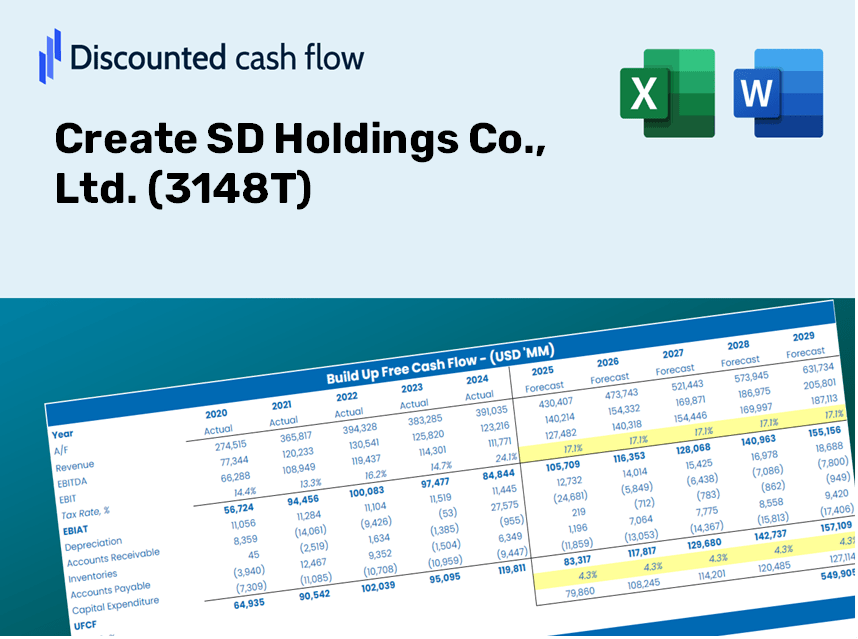
Create SD Holdings Co., Ltd. (3148.T) Bundle
Diseñada para la precisión, nuestra calculadora DCF (3148T) le permite evaluar la valoración de Crear SD Holdings Co., Ltd. con datos financieros del mundo real y una flexibilidad completa para modificar todos los parámetros esenciales para las proyecciones mejoradas.
Discounted Cash Flow (DCF) - (USD MM)
| Year | AY1 2020 |
AY2 2021 |
AY3 2022 |
AY4 2023 |
AY5 2024 |
FY1 2025 |
FY2 2026 |
FY3 2027 |
FY4 2028 |
FY5 2029 |
|---|---|---|---|---|---|---|---|---|---|---|
| Revenue | 338,476.0 | 350,744.0 | 380,963.0 | 422,330.0 | 457,093.0 | 492,894.7 | 531,500.7 | 573,130.4 | 618,020.7 | 666,427.1 |
| Revenue Growth, % | 0 | 3.62 | 8.62 | 10.86 | 8.23 | 7.83 | 7.83 | 7.83 | 7.83 | 7.83 |
| EBITDA | 21,730.0 | 22,162.0 | 23,265.0 | 25,222.0 | 28,305.0 | 30,569.2 | 32,963.6 | 35,545.4 | 38,329.5 | 41,331.7 |
| EBITDA, % | 6.42 | 6.32 | 6.11 | 5.97 | 6.19 | 6.2 | 6.2 | 6.2 | 6.2 | 6.2 |
| Depreciation | 3,822.0 | 3,983.0 | 4,351.0 | 4,995.0 | 5,675.0 | 5,748.3 | 6,198.5 | 6,684.0 | 7,207.5 | 7,772.1 |
| Depreciation, % | 1.13 | 1.14 | 1.14 | 1.18 | 1.24 | 1.17 | 1.17 | 1.17 | 1.17 | 1.17 |
| EBIT | 17,908.0 | 18,179.0 | 18,914.0 | 20,227.0 | 22,630.0 | 24,821.0 | 26,765.1 | 28,861.4 | 31,122.0 | 33,559.6 |
| EBIT, % | 5.29 | 5.18 | 4.96 | 4.79 | 4.95 | 5.04 | 5.04 | 5.04 | 5.04 | 5.04 |
| Total Cash | 39,282.0 | 42,067.0 | 37,526.0 | 38,212.0 | 37,746.0 | 50,034.0 | 53,952.9 | 58,178.7 | 62,735.6 | 67,649.3 |
| Total Cash, percent | .0 | .0 | .0 | .0 | .0 | .0 | .0 | .0 | .0 | .0 |
| Account Receivables | 9,682.0 | 11,158.0 | 13,312.0 | 15,431.0 | 17,512.0 | 16,779.1 | 18,093.3 | 19,510.5 | 21,038.6 | 22,686.5 |
| Account Receivables, % | 2.86 | 3.18 | 3.49 | 3.65 | 3.83 | 3.4 | 3.4 | 3.4 | 3.4 | 3.4 |
| Inventories | 33,499.0 | 35,674.0 | 38,552.0 | 42,130.0 | 45,803.0 | 49,470.6 | 53,345.3 | 57,523.6 | 62,029.1 | 66,887.5 |
| Inventories, % | 9.9 | 10.17 | 10.12 | 9.98 | 10.02 | 10.04 | 10.04 | 10.04 | 10.04 | 10.04 |
| Accounts Payable | 41,699.0 | 44,228.0 | 50,485.0 | 56,357.0 | 59,763.0 | 63,682.2 | 68,670.1 | 74,048.7 | 79,848.6 | 86,102.7 |
| Accounts Payable, % | 12.32 | 12.61 | 13.25 | 13.34 | 13.07 | 12.92 | 12.92 | 12.92 | 12.92 | 12.92 |
| Capital Expenditure | -7,398.0 | -7,473.0 | -15,959.0 | -15,772.0 | -17,524.0 | -15,845.3 | -17,086.4 | -18,424.7 | -19,867.8 | -21,423.9 |
| Capital Expenditure, % | -2.19 | -2.13 | -4.19 | -3.73 | -3.83 | -3.21 | -3.21 | -3.21 | -3.21 | -3.21 |
| Tax Rate, % | 28.67 | 28.67 | 28.67 | 28.67 | 28.67 | 28.67 | 28.67 | 28.67 | 28.67 | 28.67 |
| EBITAT | 12,378.8 | 12,693.5 | 13,100.2 | 14,310.0 | 16,143.0 | 17,389.2 | 18,751.2 | 20,219.9 | 21,803.6 | 23,511.4 |
| Depreciation | ||||||||||
| Changes in Account Receivables | ||||||||||
| Changes in Inventories | ||||||||||
| Changes in Accounts Payable | ||||||||||
| Capital Expenditure | ||||||||||
| UFCF | 7,320.8 | 8,081.5 | 2,717.2 | 3,708.0 | 1,946.0 | 8,276.8 | 7,662.2 | 8,262.4 | 8,909.5 | 9,607.4 |
| WACC, % | 4.92 | 4.92 | 4.92 | 4.92 | 4.92 | 4.92 | 4.92 | 4.92 | 4.92 | 4.92 |
| PV UFCF | ||||||||||
| SUM PV UFCF | 36,910.4 | |||||||||
| Long Term Growth Rate, % | 1.00 | |||||||||
| Free cash flow (T + 1) | 9,703 | |||||||||
| Terminal Value | 247,471 | |||||||||
| Present Terminal Value | 194,631 | |||||||||
| Enterprise Value | 231,541 | |||||||||
| Net Debt | -37,746 | |||||||||
| Equity Value | 269,287 | |||||||||
| Diluted Shares Outstanding, MM | 65 | |||||||||
| Equity Value Per Share | 4,168.86 |
What You Will Receive
- Comprehensive 3148T Financials: Access to both historical and projected data for precise valuation.
- Customizable Inputs: Adjust WACC, tax rates, revenue growth, and capital expenditures to suit your analysis.
- Real-Time Calculations: Dynamic calculation of intrinsic value and NPV.
- Scenario Analysis: Explore various scenarios to assess the future performance of Create SD Holdings Co., Ltd. (3148T).
- User-Friendly Interface: Designed for professionals but easy to navigate for newcomers.
Key Features
- Comprehensive Data for SD Holdings: Pre-populated with the historical financials and future projections specific to Create SD Holdings Co., Ltd. (3148T).
- Customizable Assumptions: Modify key inputs such as revenue growth rates, profit margins, WACC, tax rates, and capital expenditures.
- Interactive Valuation Model: Automatically recalculates Net Present Value (NPV) and intrinsic value in response to your adjustments.
- Scenario Analysis: Develop various forecasting scenarios to explore different valuation possibilities.
- Intuitive Interface: Designed for ease of use, catering to both seasoned professionals and newcomers.
How It Works
- Step 1: Download the Excel file for Create SD Holdings Co., Ltd. (3148T).
- Step 2: Review the pre-filled financial data and forecasts specific to Create SD Holdings Co., Ltd. (3148T).
- Step 3: Adjust key inputs such as revenue growth, WACC, and tax rates (highlighted cells).
- Step 4: Observe the DCF model update in real time as you modify the assumptions.
- Step 5: Evaluate the results and utilize the outputs for informed investment decisions.
Why Select This Calculator for Create SD Holdings Co., Ltd. (3148T)?
- Designed for Experts: A sophisticated tool tailored for analysts, CFOs, and consultants.
- Accurate Data: Historical and projected financials for Create SD Holdings Co., Ltd. (3148T) preloaded for precision.
- Flexible Scenario Analysis: Easily test various forecasts and assumptions.
- Transparent Outputs: Automatically computes intrinsic value, NPV, and essential metrics.
- User-Friendly: Step-by-step guidelines help you navigate the tool effortlessly.
Who Can Benefit from This Product?
- Professional Investors: Develop comprehensive and dependable valuation models for analyzing portfolios with Create SD Holdings Co., Ltd. (3148T).
- Corporate Finance Teams: Evaluate valuation scenarios to inform strategic decisions within their organization.
- Consultants and Advisors: Equip clients with precise valuation insights regarding Create SD Holdings Co., Ltd. (3148T).
- Students and Educators: Leverage real-world data for practical applications in financial modeling education.
- Tech Enthusiasts: Gain insights into the market valuation of tech companies, including Create SD Holdings Co., Ltd. (3148T).
Contents of the Template
- Preloaded SD Holdings Data: Historical and projected financial information, covering revenue, EBIT, and capital expenditures.
- DCF and WACC Models: High-quality spreadsheets for determining intrinsic value and Weighted Average Cost of Capital.
- Editable Inputs: Yellow-highlighted cells to modify revenue growth, tax rates, and discount rates.
- Financial Statements: Detailed annual and quarterly financial reports for thorough analysis.
- Key Ratios: Metrics for profitability, leverage, and efficiency to assess performance.
- Dashboard and Charts: Visual representations of valuation results and underlying assumptions.
Disclaimer
All information, articles, and product details provided on this website are for general informational and educational purposes only. We do not claim any ownership over, nor do we intend to infringe upon, any trademarks, copyrights, logos, brand names, or other intellectual property mentioned or depicted on this site. Such intellectual property remains the property of its respective owners, and any references here are made solely for identification or informational purposes, without implying any affiliation, endorsement, or partnership.
We make no representations or warranties, express or implied, regarding the accuracy, completeness, or suitability of any content or products presented. Nothing on this website should be construed as legal, tax, investment, financial, medical, or other professional advice. In addition, no part of this site—including articles or product references—constitutes a solicitation, recommendation, endorsement, advertisement, or offer to buy or sell any securities, franchises, or other financial instruments, particularly in jurisdictions where such activity would be unlawful.
All content is of a general nature and may not address the specific circumstances of any individual or entity. It is not a substitute for professional advice or services. Any actions you take based on the information provided here are strictly at your own risk. You accept full responsibility for any decisions or outcomes arising from your use of this website and agree to release us from any liability in connection with your use of, or reliance upon, the content or products found herein.