
|
Industrial & Infraestructura Fund Investment Corporation (3249.T) Valoración de DCF |
Completamente Editable: Adáptelo A Sus Necesidades En Excel O Sheets
Diseño Profesional: Plantillas Confiables Y Estándares De La Industria
Predeterminadas Para Un Uso Rápido Y Eficiente
Compatible con MAC / PC, completamente desbloqueado
No Se Necesita Experiencia; Fáciles De Seguir
Industrial & Infrastructure Fund Investment Corporation (3249.T) Bundle
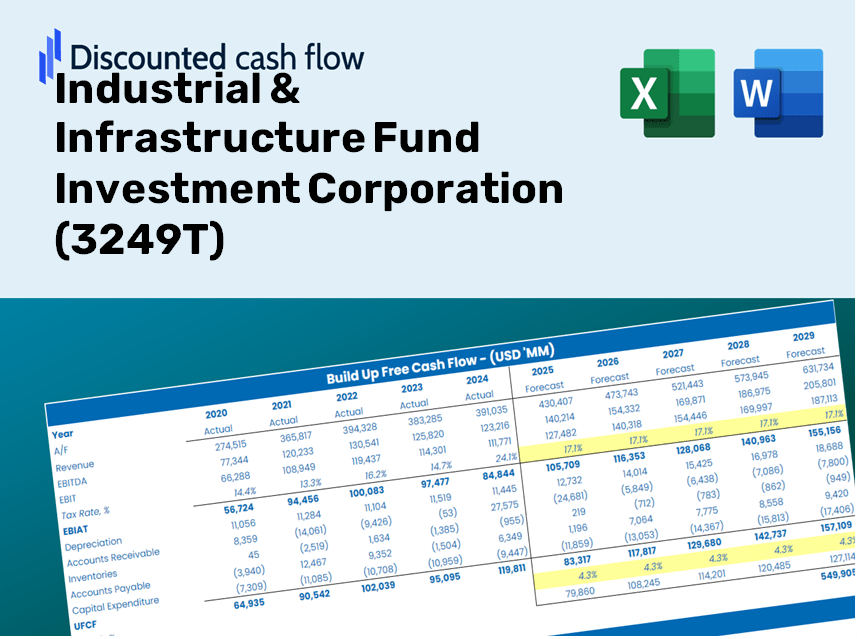
Si es un inversor o analista, esta calculadora DCF (3249T) es una herramienta esencial para una valoración precisa. Cargado de datos reales de industrial & Infraestructura Fund Investment Corporation, puede ajustar los pronósticos y observar los efectos en tiempo real.
Discounted Cash Flow (DCF) - (USD MM)
| Year | AY1 2019 |
AY2 2020 |
AY3 2021 |
AY4 2022 |
AY5 2023 |
FY1 2024 |
FY2 2025 |
FY3 2026 |
FY4 2027 |
FY5 2028 |
|---|---|---|---|---|---|---|---|---|---|---|
| Revenue | 22,033.7 | 29,242.2 | 33,687.7 | 39,163.1 | 39,233.4 | 45,545.2 | 52,872.5 | 61,378.5 | 71,253.0 | 82,716.1 |
| Revenue Growth, % | 0 | 32.72 | 15.2 | 16.25 | 0.17941 | 16.09 | 16.09 | 16.09 | 16.09 | 16.09 |
| EBITDA | 15,293.1 | 18,412.7 | 18,340.8 | 19,262.7 | 22,550.7 | 26,733.4 | 31,034.2 | 36,027.0 | 41,822.9 | 48,551.3 |
| EBITDA, % | 69.41 | 62.97 | 54.44 | 49.19 | 57.48 | 58.7 | 58.7 | 58.7 | 58.7 | 58.7 |
| Depreciation | 3,056.7 | 3,710.7 | 4,617.3 | 4,467.7 | 4,939.2 | 5,854.0 | 6,795.8 | 7,889.1 | 9,158.3 | 10,631.6 |
| Depreciation, % | 13.87 | 12.69 | 13.71 | 11.41 | 12.59 | 12.85 | 12.85 | 12.85 | 12.85 | 12.85 |
| EBIT | 12,236.4 | 14,702.0 | 13,723.5 | 14,795.0 | 17,611.5 | 20,879.4 | 24,238.4 | 28,137.9 | 32,664.7 | 37,919.7 |
| EBIT, % | 55.54 | 50.28 | 40.74 | 37.78 | 44.89 | 45.84 | 45.84 | 45.84 | 45.84 | 45.84 |
| Total Cash | 13,133.5 | 40,148.1 | 35,580.3 | 35,313.0 | 25,580.9 | 37,800.5 | 43,881.8 | 50,941.4 | 59,136.8 | 68,650.6 |
| Total Cash, percent | .0 | .0 | .0 | .0 | .0 | .0 | .0 | .0 | .0 | .0 |
| Account Receivables | 697.0 | 772.6 | 785.7 | 962.0 | 858.0 | 1,164.3 | 1,351.6 | 1,569.0 | 1,821.4 | 2,114.4 |
| Account Receivables, % | 3.16 | 2.64 | 2.33 | 2.46 | 2.19 | 2.56 | 2.56 | 2.56 | 2.56 | 2.56 |
| Inventories | 4,700.6 | 6,310.2 | 6,876.1 | .0 | .0 | 5,768.2 | 6,696.2 | 7,773.5 | 9,024.1 | 10,475.8 |
| Inventories, % | 21.33 | 21.58 | 20.41 | 0 | 0 | 12.66 | 12.66 | 12.66 | 12.66 | 12.66 |
| Accounts Payable | 769.1 | 1,640.9 | 1,764.8 | 1,386.5 | 2,168.5 | 2,132.3 | 2,475.3 | 2,873.5 | 3,335.8 | 3,872.5 |
| Accounts Payable, % | 3.49 | 5.61 | 5.24 | 3.54 | 5.53 | 4.68 | 4.68 | 4.68 | 4.68 | 4.68 |
| Capital Expenditure | -27,766.6 | -49,671.2 | -27,406.3 | -21,768.9 | -124,047.4 | -39,801.0 | -46,204.1 | -53,637.4 | -62,266.5 | -72,283.8 |
| Capital Expenditure, % | -126.02 | -169.86 | -81.35 | -55.59 | -316.18 | -87.39 | -87.39 | -87.39 | -87.39 | -87.39 |
| Tax Rate, % | 0.02644668 | 0.02644668 | 0.02644668 | 0.02644668 | 0.02644668 | 0.02644668 | 0.02644668 | 0.02644668 | 0.02644668 | 0.02644668 |
| EBITAT | 12,234.0 | 14,698.8 | 13,721.1 | 14,792.3 | 17,606.9 | 20,875.0 | 24,233.4 | 28,132.0 | 32,657.9 | 37,911.8 |
| Depreciation | ||||||||||
| Changes in Account Receivables | ||||||||||
| Changes in Inventories | ||||||||||
| Changes in Accounts Payable | ||||||||||
| Capital Expenditure | ||||||||||
| UFCF | -17,104.4 | -32,075.1 | -9,523.2 | 3,812.6 | -100,615.3 | -19,182.7 | -15,947.2 | -18,512.8 | -21,491.1 | -24,948.5 |
| WACC, % | 4.6 | 4.6 | 4.6 | 4.6 | 4.6 | 4.6 | 4.6 | 4.6 | 4.6 | 4.6 |
| PV UFCF | ||||||||||
| SUM PV UFCF | -86,974.4 | |||||||||
| Long Term Growth Rate, % | 3.00 | |||||||||
| Free cash flow (T + 1) | -25,697 | |||||||||
| Terminal Value | -1,608,611 | |||||||||
| Present Terminal Value | -1,284,828 | |||||||||
| Enterprise Value | -1,371,803 | |||||||||
| Net Debt | 256,702 | |||||||||
| Equity Value | -1,628,505 | |||||||||
| Diluted Shares Outstanding, MM | 2 | |||||||||
| Equity Value Per Share | -772,535.58 |
Benefits You Will Enjoy
- Customizable Excel Template: A fully adjustable Excel-based DCF Calculator featuring pre-populated financial data for Industrial & Infrastructure Fund Investment Corporation (3249T).
- Authentic Data: Access to historical performance metrics and forward-looking projections (indicated in the highlighted cells).
- Adaptable Forecasting: Modify key assumptions such as revenue growth, EBITDA %, and WACC to suit your analysis.
- Instant Calculations: Quickly observe how your inputs influence the valuation of Industrial & Infrastructure Fund Investment Corporation (3249T).
- Professional-Grade Tool: Designed specifically for investors, CFOs, consultants, and financial analysts.
- Intuitive Design: Organized for clarity and ease of navigation, complete with comprehensive step-by-step guidance.
Key Features
- Comprehensive DCF Calculator: Offers detailed unlevered and levered DCF valuation models tailored for Industrial & Infrastructure Fund Investment Corporation (3249T).
- WACC Calculator: Features a pre-configured Weighted Average Cost of Capital sheet with adjustable inputs.
- Customizable Forecast Assumptions: Adjust growth rates, capital expenditures, and discount rates as needed.
- Integrated Financial Ratios: Examine profitability, leverage, and efficiency ratios specific to Industrial & Infrastructure Fund Investment Corporation (3249T).
- Interactive Dashboard and Charts: Visual representations that summarize essential valuation metrics for straightforward analysis.
How It Works
- 1. Access the Template: Download and open the Excel file containing the preloaded data for Industrial & Infrastructure Fund Investment Corporation (3249T).
- 2. Modify Assumptions: Adjust key parameters such as growth rates, WACC, and capital expenditures to fit your analysis.
- 3. See Immediate Results: The DCF model automatically calculates the intrinsic value and NPV based on your inputs.
- 4. Explore Scenarios: Evaluate various forecasts to gain insights into different valuation possibilities.
- 5. Present with Assurance: Share professional valuation insights to support your strategic decisions with confidence.
Why Opt for This Calculator?
- Time Efficient: Skip the hassle of building a DCF model from scratch – it's ready for use.
- Enhanced Accuracy: Dependable financial data and well-established formulas minimize valuation errors.
- Fully Adaptable: Customize the model to fit your unique assumptions and forecasts.
- User-Friendly: Intuitive charts and outputs simplify result analysis.
- Endorsed by Professionals: Crafted for experts who prioritize precision and ease of use.
Who Should Use This Product?
- Individual Investors: Make informed decisions regarding investments in Industrial & Infrastructure Fund Investment Corporation (3249T).
- Financial Analysts: Enhance valuation processes with comprehensive financial models tailored for (3249T).
- Consultants: Provide clients with precise and timely valuation insights related to (3249T).
- Business Owners: Gain a better understanding of how firms like Industrial & Infrastructure Fund Investment Corporation (3249T) are valued to inform your strategic approach.
- Finance Students: Acquire practical knowledge of valuation techniques using real-world examples and data from (3249T).
Contents of the Template
- Comprehensive DCF Model: An editable template featuring in-depth valuation calculations.
- Real-World Data: Historical and projected financial data for Industrial & Infrastructure Fund Investment Corporation (3249T) preloaded for ease of analysis.
- Customizable Parameters: Options to modify WACC, growth rates, and tax assumptions to explore various scenarios.
- Financial Statements: Complete annual and quarterly financial breakdowns for enhanced insights.
- Key Ratios: Integrated analysis of profitability, efficiency, and leverage metrics.
- Dashboard with Visual Outputs: Visualizations such as charts and tables to present clear, actionable insights.
Disclaimer
All information, articles, and product details provided on this website are for general informational and educational purposes only. We do not claim any ownership over, nor do we intend to infringe upon, any trademarks, copyrights, logos, brand names, or other intellectual property mentioned or depicted on this site. Such intellectual property remains the property of its respective owners, and any references here are made solely for identification or informational purposes, without implying any affiliation, endorsement, or partnership.
We make no representations or warranties, express or implied, regarding the accuracy, completeness, or suitability of any content or products presented. Nothing on this website should be construed as legal, tax, investment, financial, medical, or other professional advice. In addition, no part of this site—including articles or product references—constitutes a solicitation, recommendation, endorsement, advertisement, or offer to buy or sell any securities, franchises, or other financial instruments, particularly in jurisdictions where such activity would be unlawful.
All content is of a general nature and may not address the specific circumstances of any individual or entity. It is not a substitute for professional advice or services. Any actions you take based on the information provided here are strictly at your own risk. You accept full responsibility for any decisions or outcomes arising from your use of this website and agree to release us from any liability in connection with your use of, or reliance upon, the content or products found herein.