
|
China National Building Material Company Limited (3323.HK) Valoración de DCF |
Completamente Editable: Adáptelo A Sus Necesidades En Excel O Sheets
Diseño Profesional: Plantillas Confiables Y Estándares De La Industria
Predeterminadas Para Un Uso Rápido Y Eficiente
Compatible con MAC / PC, completamente desbloqueado
No Se Necesita Experiencia; Fáciles De Seguir
China National Building Material Company Limited (3323.HK) Bundle
¡Simplifique la valoración de la Compañía Nacional de Materiales de Construcción de China (3323HK) con esta calculadora DCF personalizable! Con Real China National Building Material Company Limited (3323HK) financieras y aportes de pronóstico ajustables, puede probar escenarios y descubrir el valor razonable de China National Material Company Limited (3323HK) en minutos.
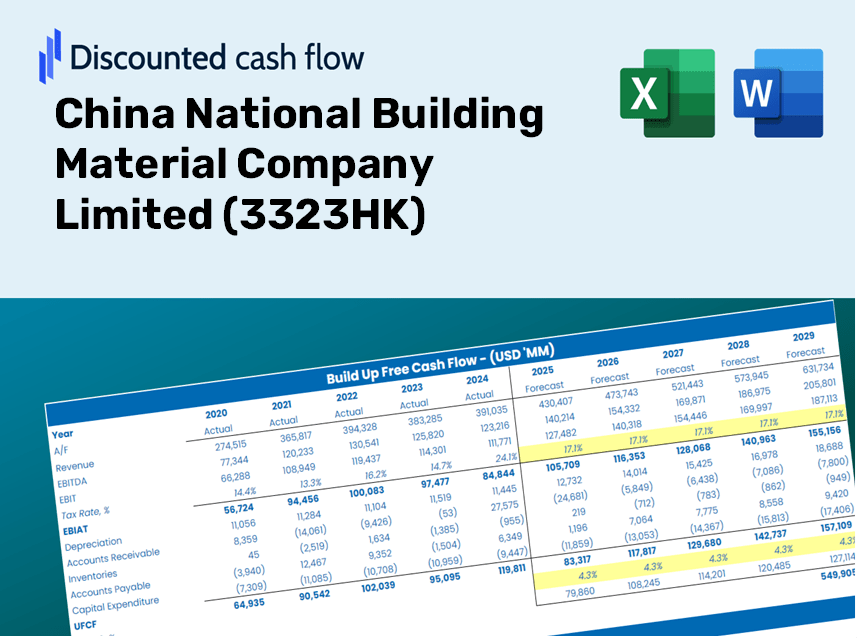
Discounted Cash Flow (DCF) - (USD MM)
| Year | AY1 2020 |
AY2 2021 |
AY3 2022 |
AY4 2023 |
AY5 2024 |
FY1 2025 |
FY2 2026 |
FY3 2027 |
FY4 2028 |
FY5 2029 |
|---|---|---|---|---|---|---|---|---|---|---|
| Revenue | 278,556.1 | 299,244.9 | 255,723.7 | 229,850.2 | 198,233.8 | 182,875.9 | 168,707.9 | 155,637.4 | 143,579.6 | 132,456.0 |
| Revenue Growth, % | 0 | 7.43 | -14.54 | -10.12 | -13.76 | -7.75 | -7.75 | -7.75 | -7.75 | -7.75 |
| EBITDA | 57,466.4 | 61,967.6 | 31,006.7 | 29,021.9 | 33,680.0 | 30,386.5 | 28,032.4 | 25,860.6 | 23,857.1 | 22,008.8 |
| EBITDA, % | 20.63 | 20.71 | 12.13 | 12.63 | 16.99 | 16.62 | 16.62 | 16.62 | 16.62 | 16.62 |
| Depreciation | 15,852.8 | 16,212.2 | 14,321.0 | 15,214.9 | 17,574.1 | 11,774.9 | 10,862.7 | 10,021.1 | 9,244.7 | 8,528.5 |
| Depreciation, % | 5.69 | 5.42 | 5.6 | 6.62 | 8.87 | 6.44 | 6.44 | 6.44 | 6.44 | 6.44 |
| EBIT | 41,613.7 | 45,755.4 | 16,685.7 | 13,807.0 | 16,105.9 | 18,611.6 | 17,169.7 | 15,839.5 | 14,612.4 | 13,480.3 |
| EBIT, % | 14.94 | 15.29 | 6.52 | 6.01 | 8.12 | 10.18 | 10.18 | 10.18 | 10.18 | 10.18 |
| Total Cash | 39,225.1 | 38,837.4 | 38,332.4 | 40,855.0 | 36,035.3 | 28,529.6 | 26,319.3 | 24,280.3 | 22,399.2 | 20,663.8 |
| Total Cash, percent | .0 | .0 | .0 | .0 | .0 | .0 | .0 | .0 | .0 | .0 |
| Account Receivables | 103,090.6 | 97,303.7 | 97,352.7 | 91,566.3 | 98,755.9 | 72,144.6 | 66,555.3 | 61,399.0 | 56,642.2 | 52,253.9 |
| Account Receivables, % | 37.01 | 32.52 | 38.07 | 39.84 | 49.82 | 39.45 | 39.45 | 39.45 | 39.45 | 39.45 |
| Inventories | 22,182.8 | 24,195.9 | 26,848.9 | 23,101.8 | 18,534.5 | 16,805.9 | 15,503.9 | 14,302.8 | 13,194.7 | 12,172.4 |
| Inventories, % | 7.96 | 8.09 | 10.5 | 10.05 | 9.35 | 9.19 | 9.19 | 9.19 | 9.19 | 9.19 |
| Accounts Payable | 107,512.3 | 111,170.9 | 73,293.8 | 67,826.9 | 65,102.8 | 60,992.3 | 56,267.0 | 51,907.8 | 47,886.3 | 44,176.4 |
| Accounts Payable, % | 38.6 | 37.15 | 28.66 | 29.51 | 32.84 | 33.35 | 33.35 | 33.35 | 33.35 | 33.35 |
| Capital Expenditure | -30,448.2 | -40,382.7 | -33,975.5 | -24,101.7 | -23,836.5 | -22,026.3 | -20,319.8 | -18,745.6 | -17,293.3 | -15,953.5 |
| Capital Expenditure, % | -10.93 | -13.49 | -13.29 | -10.49 | -12.02 | -12.04 | -12.04 | -12.04 | -12.04 | -12.04 |
| Tax Rate, % | 69.43 | 69.43 | 69.43 | 69.43 | 69.43 | 69.43 | 69.43 | 69.43 | 69.43 | 69.43 |
| EBITAT | 18,779.9 | 23,287.5 | 8,169.9 | 4,868.7 | 4,922.9 | 7,847.3 | 7,239.3 | 6,678.5 | 6,161.0 | 5,683.7 |
| Depreciation | ||||||||||
| Changes in Account Receivables | ||||||||||
| Changes in Inventories | ||||||||||
| Changes in Accounts Payable | ||||||||||
| Capital Expenditure | ||||||||||
| UFCF | -13,576.6 | 6,549.3 | -52,063.7 | 48.4 | -6,686.0 | 21,825.3 | -51.8 | -47.8 | -44.1 | -40.7 |
| WACC, % | 2.93 | 3.11 | 3.05 | 2.63 | 2.49 | 2.84 | 2.84 | 2.84 | 2.84 | 2.84 |
| PV UFCF | ||||||||||
| SUM PV UFCF | 21,054.6 | |||||||||
| Long Term Growth Rate, % | 0.50 | |||||||||
| Free cash flow (T + 1) | -41 | |||||||||
| Terminal Value | -1,746 | |||||||||
| Present Terminal Value | -1,518 | |||||||||
| Enterprise Value | 19,537 | |||||||||
| Net Debt | 186,909 | |||||||||
| Equity Value | -167,372 | |||||||||
| Diluted Shares Outstanding, MM | 8,435 | |||||||||
| Equity Value Per Share | -19.84 |
What You Will Receive
- Authentic CNBM Data: Preloaded financial information – including revenue and EBIT – based on actual and projected metrics.
- Comprehensive Customization: Modify all essential parameters (yellow cells) such as WACC, growth percentages, and tax rates.
- Immediate Valuation Adjustments: Automatic recalculations to evaluate the effects of changes on the fair value of CNBM (3323HK).
- Flexible Excel Template: Designed for quick modifications, scenario analysis, and in-depth projections.
- Efficient and Accurate: Avoid starting models from scratch while ensuring precision and adaptability.
Key Features
- Authentic Financial Data for China National Building Material Company Limited (3323HK): Gain access to precise historical data and future forecasts already loaded into the system.
- Tailorable Forecast Inputs: Modify the highlighted cells like WACC, growth rates, and profit margins to suit your analysis.
- Real-Time Calculations: Enjoy automatic updates for DCF, Net Present Value (NPV), and cash flow evaluations.
- User-Friendly Dashboard: View easily digestible charts and summaries for a clear understanding of your valuation analysis.
- Designed for All Levels: A straightforward, user-oriented format ideal for investors, CFOs, and consultants alike.
How It Operates
- 1. Access the Template: Download and open the Excel file containing China National Building Material Company Limited’s (3323HK) preloaded data.
- 2. Modify Assumptions: Adjust key inputs such as growth rates, WACC, and capital expenditures.
- 3. View Results in Real-Time: The DCF model automatically computes intrinsic value and NPV.
- 4. Analyze Different Scenarios: Evaluate multiple forecasts to explore various valuation outcomes.
- 5. Present with Assurance: Deliver professional valuation analyses to reinforce your decision-making process.
Why Opt for This Calculator?
- Designed for Professionals: A sophisticated tool tailored for analysts, CFOs, and consultants.
- Accurate Financial Data: Historical and projected financials for China National Building Material Company Limited (3323HK) preloaded for precision.
- Versatile Scenario Testing: Effortlessly simulate various forecasts and assumptions.
- Clear and Concise Outputs: Automatically computes intrinsic value, NPV, and essential metrics.
- User-Friendly Interface: Step-by-step guidance to help you navigate the process easily.
Who Can Benefit from This Product?
- Investors: Empower your investment choices with a professional-grade valuation tool tailored for (3323HK).
- Financial Analysts: Enhance your efficiency with a pre-designed DCF model that can be customized for (3323HK).
- Consultants: Effortlessly modify the template for client presentations or reports related to (3323HK).
- Finance Enthusiasts: Expand your knowledge of valuation methods through practical, real-world examples featuring (3323HK).
- Educators and Students: Utilize it as a hands-on learning resource in finance courses focusing on (3323HK).
What the Template Includes
- Historical Data: Comprises past financials and baseline forecasts for China National Building Material Company Limited (3323HK).
- DCF and Levered DCF Models: Comprehensive templates to determine the intrinsic value of China National Building Material Company Limited (3323HK).
- WACC Sheet: Ready-to-use calculations for Weighted Average Cost of Capital.
- Editable Inputs: Adjust key drivers such as growth rates, EBITDA %, and CAPEX assumptions.
- Quarterly and Annual Statements: A full breakdown of the financials for China National Building Material Company Limited (3323HK).
- Interactive Dashboard: Dynamically visualize valuation results and forecasts.
Disclaimer
All information, articles, and product details provided on this website are for general informational and educational purposes only. We do not claim any ownership over, nor do we intend to infringe upon, any trademarks, copyrights, logos, brand names, or other intellectual property mentioned or depicted on this site. Such intellectual property remains the property of its respective owners, and any references here are made solely for identification or informational purposes, without implying any affiliation, endorsement, or partnership.
We make no representations or warranties, express or implied, regarding the accuracy, completeness, or suitability of any content or products presented. Nothing on this website should be construed as legal, tax, investment, financial, medical, or other professional advice. In addition, no part of this site—including articles or product references—constitutes a solicitation, recommendation, endorsement, advertisement, or offer to buy or sell any securities, franchises, or other financial instruments, particularly in jurisdictions where such activity would be unlawful.
All content is of a general nature and may not address the specific circumstances of any individual or entity. It is not a substitute for professional advice or services. Any actions you take based on the information provided here are strictly at your own risk. You accept full responsibility for any decisions or outcomes arising from your use of this website and agree to release us from any liability in connection with your use of, or reliance upon, the content or products found herein.