
|
Logan Group Company Limited (3380.HK) Valoración de DCF |
Completamente Editable: Adáptelo A Sus Necesidades En Excel O Sheets
Diseño Profesional: Plantillas Confiables Y Estándares De La Industria
Predeterminadas Para Un Uso Rápido Y Eficiente
Compatible con MAC / PC, completamente desbloqueado
No Se Necesita Experiencia; Fáciles De Seguir
Logan Group Company Limited (3380.HK) Bundle
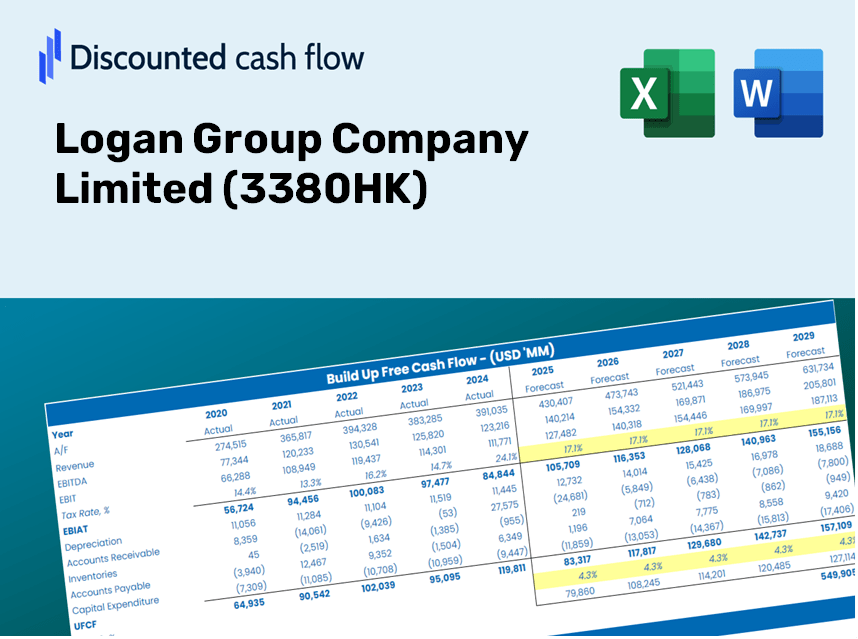
¡Optimice su tiempo y mejore la precisión con nuestra calculadora DCF (3380HK)! Equipado con datos limitados reales de Logan Group Company y suposiciones personalizables, esta herramienta le permite pronosticar, analizar y evaluar (3380HK) como un inversor experimentado.
Discounted Cash Flow (DCF) - (USD MM)
| Year | AY1 2020 |
AY2 2021 |
AY3 2022 |
AY4 2023 |
AY5 2024 |
FY1 2025 |
FY2 2026 |
FY3 2027 |
FY4 2028 |
FY5 2029 |
|---|---|---|---|---|---|---|---|---|---|---|
| Revenue | 77,718.4 | 85,605.0 | 45,510.1 | 51,572.1 | 25,437.5 | 20,728.7 | 16,891.5 | 13,764.7 | 11,216.6 | 9,140.3 |
| Revenue Growth, % | 0 | 10.15 | -46.84 | 13.32 | -50.68 | -18.51 | -18.51 | -18.51 | -18.51 | -18.51 |
| EBITDA | 19,707.0 | 14,771.3 | -6,359.0 | -5,901.7 | -7,042.6 | -434.9 | -354.4 | -288.8 | -235.3 | -191.8 |
| EBITDA, % | 25.36 | 17.26 | -13.97 | -11.44 | -27.69 | -2.1 | -2.1 | -2.1 | -2.1 | -2.1 |
| Depreciation | 65.7 | 61.8 | 44.0 | 58.5 | 58.5 | 24.7 | 20.2 | 16.4 | 13.4 | 10.9 |
| Depreciation, % | 0.08455294 | 0.07213579 | 0.09666371 | 0.11343 | 0.22997 | 0.11935 | 0.11935 | 0.11935 | 0.11935 | 0.11935 |
| EBIT | 19,641.3 | 14,709.6 | -6,403.0 | -5,960.2 | -7,101.1 | -459.6 | -374.6 | -305.2 | -248.7 | -202.7 |
| EBIT, % | 25.27 | 17.18 | -14.07 | -11.56 | -27.92 | -2.22 | -2.22 | -2.22 | -2.22 | -2.22 |
| Total Cash | 44,872.9 | 40,576.6 | 15,418.8 | 14,401.7 | 9,462.0 | 8,463.1 | 6,896.5 | 5,619.8 | 4,579.5 | 3,731.8 |
| Total Cash, percent | .0 | .0 | .0 | .0 | .0 | .0 | .0 | .0 | .0 | .0 |
| Account Receivables | 42,855.5 | 61,745.6 | 49,183.1 | 1,488.9 | 2,641.7 | 9,972.3 | 8,126.3 | 6,622.0 | 5,396.2 | 4,397.3 |
| Account Receivables, % | 55.14 | 72.13 | 108.07 | 2.89 | 10.39 | 48.11 | 48.11 | 48.11 | 48.11 | 48.11 |
| Inventories | 116,257.7 | 127,979.2 | 161,958.2 | 163,906.0 | 133,170.6 | 20,728.7 | 16,891.5 | 13,764.7 | 11,216.6 | 9,140.3 |
| Inventories, % | 149.59 | 149.5 | 355.87 | 317.82 | 523.52 | 100 | 100 | 100 | 100 | 100 |
| Accounts Payable | 23,708.6 | 24,482.2 | 24,816.3 | 32,578.5 | 25,451.2 | 11,475.6 | 9,351.3 | 7,620.3 | 6,209.6 | 5,060.2 |
| Accounts Payable, % | 30.51 | 28.6 | 54.53 | 63.17 | 100.05 | 55.36 | 55.36 | 55.36 | 55.36 | 55.36 |
| Capital Expenditure | -76.7 | -236.8 | -153.6 | -70.0 | -6.0 | -36.2 | -29.5 | -24.0 | -19.6 | -15.9 |
| Capital Expenditure, % | -0.09872716 | -0.2766 | -0.33761 | -0.13577 | -0.02369693 | -0.17448 | -0.17448 | -0.17448 | -0.17448 | -0.17448 |
| Tax Rate, % | 15.25 | 15.25 | 15.25 | 15.25 | 15.25 | 15.25 | 15.25 | 15.25 | 15.25 | 15.25 |
| EBITAT | 13,112.5 | 9,921.4 | -7,099.4 | -7,530.1 | -6,018.4 | -385.1 | -313.8 | -255.8 | -208.4 | -169.8 |
| Depreciation | ||||||||||
| Changes in Account Receivables | ||||||||||
| Changes in Inventories | ||||||||||
| Changes in Accounts Payable | ||||||||||
| Capital Expenditure | ||||||||||
| UFCF | -122,303.2 | -20,091.6 | -28,291.4 | 45,966.9 | 16,489.3 | 90,739.2 | 3,235.7 | 2,636.7 | 2,148.6 | 1,750.9 |
| WACC, % | 3.51 | 3.54 | 4.67 | 4.67 | 4.14 | 4.11 | 4.11 | 4.11 | 4.11 | 4.11 |
| PV UFCF | ||||||||||
| SUM PV UFCF | 95,741.7 | |||||||||
| Long Term Growth Rate, % | 2.00 | |||||||||
| Free cash flow (T + 1) | 1,786 | |||||||||
| Terminal Value | 84,727 | |||||||||
| Present Terminal Value | 69,279 | |||||||||
| Enterprise Value | 165,021 | |||||||||
| Net Debt | 107,098 | |||||||||
| Equity Value | 57,923 | |||||||||
| Diluted Shares Outstanding, MM | 5,527 | |||||||||
| Equity Value Per Share | 10.48 |
What You Will Receive
- Authentic LOGN Financial Data: Comes pre-loaded with Logan Group’s historical and forecasted figures for accurate evaluations.
- Completely Customizable Template: Effortlessly adjust essential inputs such as revenue growth, WACC, and EBITDA percentage.
- Instantaneous Calculations: Observe real-time updates of Logan Group’s intrinsic value as you make adjustments.
- Expert Valuation Tool: Tailored for investors, analysts, and consultants aiming for precise DCF analysis.
- Intuitive Interface: Streamlined layout and straightforward guidance suitable for users of all expertise levels.
Highlighted Features
- Customizable Forecast Inputs: Adjust essential parameters such as revenue expansion, EBITDA percentage, and capital expenditures.
- Instant DCF Valuation: Quickly computes intrinsic value, NPV, and additional metrics.
- High-Precision Accuracy: Leverages Logan Group Company Limited’s real financial data for credible valuation results.
- Simplified Scenario Analysis: Effortlessly experiment with various assumptions and evaluate different outcomes.
- Efficiency Booster: Removes the hassle of constructing intricate valuation models from the ground up.
How It Works
- Step 1: Download the Excel file for Logan Group Company Limited (3380HK).
- Step 2: Examine the pre-filled financial data and forecasts for Logan Group.
- Step 3: Adjust key inputs such as revenue growth, WACC, and tax rates (highlighted cells).
- Step 4: Watch the DCF model refresh in real-time as you make changes to your assumptions.
- Step 5: Review the results and utilize the insights for your investment strategies.
Why Select Logan Group Company Limited (3380HK) Calculator?
- Precision: Utilizes accurate financial data from Logan Group Company Limited for reliable results.
- Adaptability: Built for users to easily test and adjust their inputs as needed.
- Efficiency: Eliminate the complexity of creating a DCF model from the ground up.
- High-Quality: Crafted with the expertise and attention to detail expected at a CFO level.
- Accessible: Intuitive interface designed for all users, regardless of their financial modeling background.
Who Can Benefit from Logan Group Company Limited (3380HK)?
- Finance Students: Master valuation methodologies and apply them to real-world data.
- Researchers: Utilize industry models in your academic work and studies.
- Investors: Evaluate your own investment strategies and assess valuation results for Logan Group (3380HK).
- Market Analysts: Enhance your efficiency with a pre-built, adaptable DCF model.
- Entrepreneurs: Discover how major publicly traded companies like Logan Group (3380HK) are analyzed.
Contents of the Template
- Preloaded LOGAN Data: Historical and projected financial information, encompassing revenue, EBIT, and capital expenditures.
- DCF and WACC Models: High-quality spreadsheets designed for calculating intrinsic value and Weighted Average Cost of Capital.
- Editable Inputs: Yellow-highlighted cells for modifying revenue growth, tax rates, and discount rates.
- Financial Statements: Detailed annual and quarterly financials for in-depth analysis.
- Key Ratios: Profitability, leverage, and efficiency ratios to assess performance.
- Dashboard and Charts: Visual representations of valuation results and underlying assumptions.
Disclaimer
All information, articles, and product details provided on this website are for general informational and educational purposes only. We do not claim any ownership over, nor do we intend to infringe upon, any trademarks, copyrights, logos, brand names, or other intellectual property mentioned or depicted on this site. Such intellectual property remains the property of its respective owners, and any references here are made solely for identification or informational purposes, without implying any affiliation, endorsement, or partnership.
We make no representations or warranties, express or implied, regarding the accuracy, completeness, or suitability of any content or products presented. Nothing on this website should be construed as legal, tax, investment, financial, medical, or other professional advice. In addition, no part of this site—including articles or product references—constitutes a solicitation, recommendation, endorsement, advertisement, or offer to buy or sell any securities, franchises, or other financial instruments, particularly in jurisdictions where such activity would be unlawful.
All content is of a general nature and may not address the specific circumstances of any individual or entity. It is not a substitute for professional advice or services. Any actions you take based on the information provided here are strictly at your own risk. You accept full responsibility for any decisions or outcomes arising from your use of this website and agree to release us from any liability in connection with your use of, or reliance upon, the content or products found herein.