
|
Wasion Holdings Limited (3393.HK) DCF Valoración |
Completamente Editable: Adáptelo A Sus Necesidades En Excel O Sheets
Diseño Profesional: Plantillas Confiables Y Estándares De La Industria
Predeterminadas Para Un Uso Rápido Y Eficiente
Compatible con MAC / PC, completamente desbloqueado
No Se Necesita Experiencia; Fáciles De Seguir
Wasion Holdings Limited (3393.HK) Bundle
Ingementista para su precisión, nuestra calculadora DCF (3393HK) le permite evaluar la valoración de Wasion Holdings Limited utilizando datos financieros del mundo real, ofreciendo una flexibilidad completa para modificar todos los parámetros esenciales para las proyecciones mejoradas.
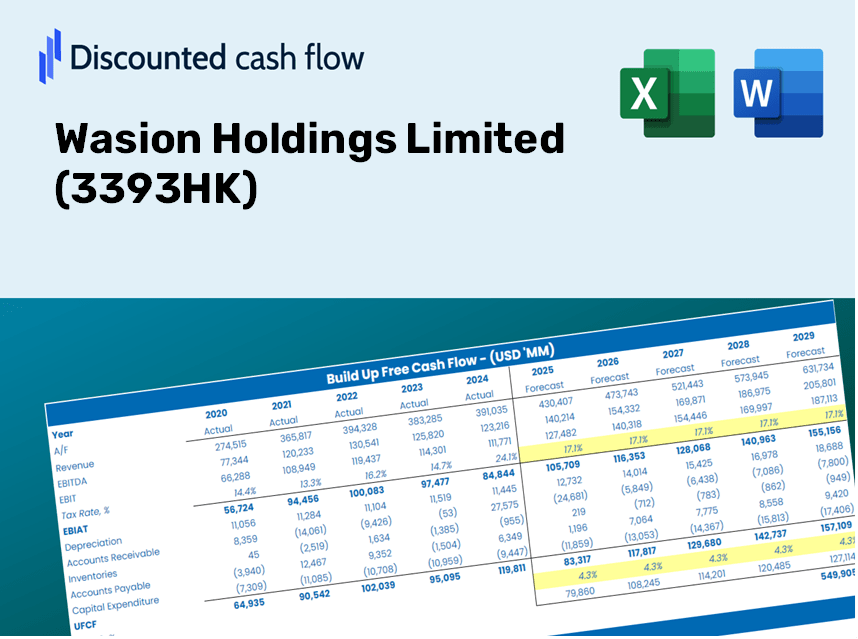
Discounted Cash Flow (DCF) - (USD MM)
| Year | AY1 2020 |
AY2 2021 |
AY3 2022 |
AY4 2023 |
AY5 2024 |
FY1 2025 |
FY2 2026 |
FY3 2027 |
FY4 2028 |
FY5 2029 |
|---|---|---|---|---|---|---|---|---|---|---|
| Revenue | 4,317.6 | 5,019.5 | 6,402.8 | 7,929.6 | 9,530.6 | 11,623.9 | 14,176.9 | 17,290.6 | 21,088.1 | 25,719.8 |
| Revenue Growth, % | 0 | 16.26 | 27.56 | 23.85 | 20.19 | 21.96 | 21.96 | 21.96 | 21.96 | 21.96 |
| EBITDA | 430.5 | 513.5 | 707.3 | 1,061.9 | 1,324.9 | 1,360.9 | 1,659.8 | 2,024.4 | 2,469.0 | 3,011.3 |
| EBITDA, % | 9.97 | 10.23 | 11.05 | 13.39 | 13.9 | 11.71 | 11.71 | 11.71 | 11.71 | 11.71 |
| Depreciation | 74.2 | 87.6 | 112.2 | 133.2 | 133.2 | 192.8 | 235.1 | 286.8 | 349.8 | 426.6 |
| Depreciation, % | 1.72 | 1.74 | 1.75 | 1.68 | 1.4 | 1.66 | 1.66 | 1.66 | 1.66 | 1.66 |
| EBIT | 356.3 | 426.0 | 595.1 | 928.7 | 1,191.7 | 1,168.1 | 1,424.7 | 1,737.6 | 2,119.2 | 2,584.7 |
| EBIT, % | 8.25 | 8.49 | 9.29 | 11.71 | 12.5 | 10.05 | 10.05 | 10.05 | 10.05 | 10.05 |
| Total Cash | 2,772.3 | 2,819.8 | 2,293.9 | 3,241.8 | 3,105.6 | 5,339.6 | 6,512.3 | 7,942.6 | 9,687.1 | 11,814.6 |
| Total Cash, percent | .0 | .0 | .0 | .0 | .0 | .0 | .0 | .0 | .0 | .0 |
| Account Receivables | 4,921.7 | 5,097.9 | 5,410.0 | 5,418.0 | 6,984.6 | 9,906.0 | 12,081.7 | 14,735.3 | 17,971.6 | 21,918.7 |
| Account Receivables, % | 113.99 | 101.56 | 84.5 | 68.33 | 73.29 | 85.22 | 85.22 | 85.22 | 85.22 | 85.22 |
| Inventories | 544.3 | 1,083.3 | 1,181.8 | 1,318.5 | 1,382.2 | 1,947.6 | 2,375.4 | 2,897.1 | 3,533.4 | 4,309.4 |
| Inventories, % | 12.61 | 21.58 | 18.46 | 16.63 | 14.5 | 16.76 | 16.76 | 16.76 | 16.76 | 16.76 |
| Accounts Payable | 3,239.9 | 3,622.1 | 3,981.7 | 4,306.4 | 5,556.3 | 7,485.7 | 9,129.8 | 11,135.0 | 13,580.6 | 16,563.3 |
| Accounts Payable, % | 75.04 | 72.16 | 62.19 | 54.31 | 58.3 | 64.4 | 64.4 | 64.4 | 64.4 | 64.4 |
| Capital Expenditure | -107.4 | -236.9 | -269.3 | -617.3 | -571.1 | -585.6 | -714.2 | -871.1 | -1,062.4 | -1,295.8 |
| Capital Expenditure, % | -2.49 | -4.72 | -4.21 | -7.78 | -5.99 | -5.04 | -5.04 | -5.04 | -5.04 | -5.04 |
| Tax Rate, % | 41.57 | 41.57 | 41.57 | 41.57 | 41.57 | 41.57 | 41.57 | 41.57 | 41.57 | 41.57 |
| EBITAT | 208.0 | 241.6 | 330.8 | 562.4 | 696.3 | 676.8 | 825.4 | 1,006.7 | 1,227.8 | 1,497.5 |
| Depreciation | ||||||||||
| Changes in Account Receivables | ||||||||||
| Changes in Inventories | ||||||||||
| Changes in Accounts Payable | ||||||||||
| Capital Expenditure | ||||||||||
| UFCF | -2,051.3 | -240.7 | 122.7 | 258.2 | -121.9 | -1,273.6 | -613.0 | -747.7 | -911.9 | -1,112.2 |
| WACC, % | 8.4 | 8.39 | 8.38 | 8.42 | 8.4 | 8.4 | 8.4 | 8.4 | 8.4 | 8.4 |
| PV UFCF | ||||||||||
| SUM PV UFCF | -3,687.4 | |||||||||
| Long Term Growth Rate, % | 2.00 | |||||||||
| Free cash flow (T + 1) | -1,134 | |||||||||
| Terminal Value | -17,735 | |||||||||
| Present Terminal Value | -11,851 | |||||||||
| Enterprise Value | -15,538 | |||||||||
| Net Debt | -184 | |||||||||
| Equity Value | -15,355 | |||||||||
| Diluted Shares Outstanding, MM | 990 | |||||||||
| Equity Value Per Share | -15.51 |
Your Benefits
- Adjustable Forecast Inputs: Effortlessly modify key assumptions (growth %, margins, WACC) to explore various scenarios.
- Relevant Market Data: Wasion Holdings Limited’s financial information pre-loaded to facilitate your analysis.
- Automated DCF Calculations: The model computes Net Present Value (NPV) and intrinsic value automatically.
- Tailorable and Professional: A sophisticated Excel template that aligns with your valuation requirements.
- Designed for Analysts and Investors: Perfect for evaluating projections, confirming strategies, and enhancing efficiency.
Key Features
- Pre-Loaded Data: Wasion Holdings Limited’s historical financial statements and pre-populated forecasts.
- Fully Adjustable Inputs: Modify WACC, tax rates, revenue growth, and EBITDA margins as needed.
- Instant Results: Watch Wasion Holdings Limited’s intrinsic value update in real time.
- Clear Visual Outputs: Dashboard charts present valuation results and essential metrics.
- Built for Accuracy: A robust tool designed for analysts, investors, and finance professionals.
How It Works
- Step 1: Download the Excel file.
- Step 2: Review Wasion Holdings Limited's (3393HK) pre-filled financial data and forecasts.
- Step 3: Adjust essential inputs such as revenue growth, WACC, and tax rates (highlighted cells).
- Step 4: Observe the DCF model update in real-time as you modify assumptions.
- Step 5: Evaluate the outputs and apply the findings to your investment choices.
Why Opt for This Calculator?
- Designed for Experts: A sophisticated tool utilized by financial analysts, CFOs, and consultants.
- Accurate Financial Data: Wasion Holdings Limited’s historical and projected financials preloaded for precision.
- Scenario Analysis: Effortlessly test various forecasts and assumptions.
- Comprehensive Outputs: Automatically computes intrinsic value, NPV, and essential metrics.
- User-Friendly: Step-by-step guidance to assist you through each stage.
Who Should Use This Product?
- Individual Investors: Make informed decisions about buying or selling Wasion Holdings Limited (3393HK) stock.
- Financial Analysts: Enhance valuation processes with ready-to-use financial models for Wasion Holdings Limited (3393HK).
- Consultants: Provide clients with accurate and timely valuation insights on Wasion Holdings Limited (3393HK).
- Business Owners: Gain an understanding of how companies like Wasion Holdings Limited (3393HK) are valued to inform your own business strategy.
- Finance Students: Learn valuation techniques through the analysis of real-world data and case studies involving Wasion Holdings Limited (3393HK).
Contents of the Template
- Pre-Filled DCF Model: Wasion Holdings Limited’s financial data pre-loaded for immediate application.
- WACC Calculator: Comprehensive calculations for Weighted Average Cost of Capital.
- Financial Ratios: Assess Wasion Holdings Limited's profitability, leverage, and operational efficiency.
- Editable Inputs: Modify assumptions such as growth rates, margins, and capital expenditures to suit your analyses.
- Financial Statements: Access annual and quarterly reports for in-depth evaluation.
- Interactive Dashboard: Effortlessly visualize essential valuation metrics and outcomes.
Disclaimer
All information, articles, and product details provided on this website are for general informational and educational purposes only. We do not claim any ownership over, nor do we intend to infringe upon, any trademarks, copyrights, logos, brand names, or other intellectual property mentioned or depicted on this site. Such intellectual property remains the property of its respective owners, and any references here are made solely for identification or informational purposes, without implying any affiliation, endorsement, or partnership.
We make no representations or warranties, express or implied, regarding the accuracy, completeness, or suitability of any content or products presented. Nothing on this website should be construed as legal, tax, investment, financial, medical, or other professional advice. In addition, no part of this site—including articles or product references—constitutes a solicitation, recommendation, endorsement, advertisement, or offer to buy or sell any securities, franchises, or other financial instruments, particularly in jurisdictions where such activity would be unlawful.
All content is of a general nature and may not address the specific circumstances of any individual or entity. It is not a substitute for professional advice or services. Any actions you take based on the information provided here are strictly at your own risk. You accept full responsibility for any decisions or outcomes arising from your use of this website and agree to release us from any liability in connection with your use of, or reliance upon, the content or products found herein.