
|
Kuraray Co., Ltd. (3405.T) Valoración de DCF |
Completamente Editable: Adáptelo A Sus Necesidades En Excel O Sheets
Diseño Profesional: Plantillas Confiables Y Estándares De La Industria
Predeterminadas Para Un Uso Rápido Y Eficiente
Compatible con MAC / PC, completamente desbloqueado
No Se Necesita Experiencia; Fáciles De Seguir
Kuraray Co., Ltd. (3405.T) Bundle
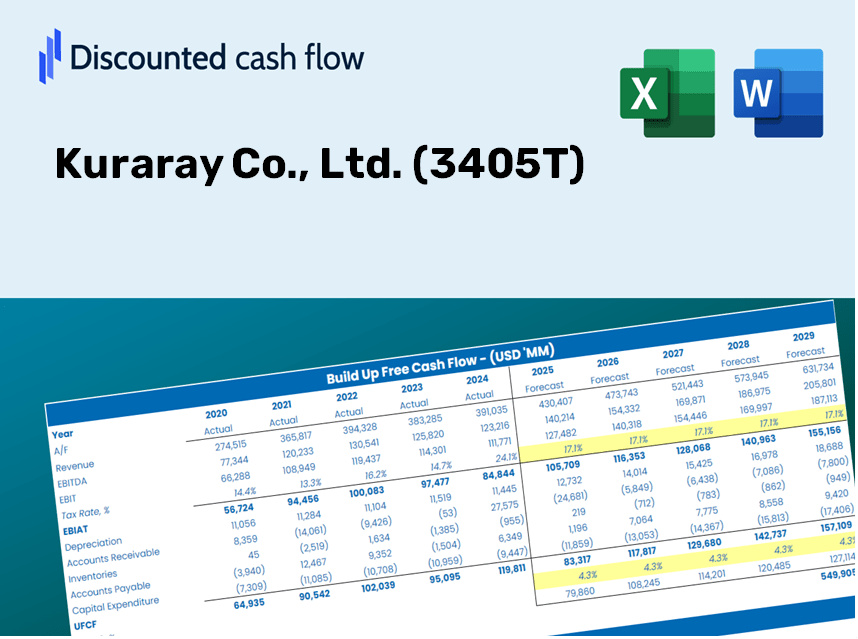
¿Busca evaluar el valor intrínseco de Kuraray Co., Ltd.? Nuestra calculadora DCF (3405T) integra datos del mundo real con funciones de personalización integrales, lo que le permite refinar sus pronósticos y tomar decisiones de inversión más informadas.
Discounted Cash Flow (DCF) - (USD MM)
| Year | AY1 2020 |
AY2 2021 |
AY3 2022 |
AY4 2023 |
AY5 2024 |
FY1 2025 |
FY2 2026 |
FY3 2027 |
FY4 2028 |
FY5 2029 |
|---|---|---|---|---|---|---|---|---|---|---|
| Revenue | 541,797.0 | 629,370.0 | 756,376.0 | 780,938.0 | 826,895.0 | 920,903.6 | 1,025,599.9 | 1,142,199.0 | 1,272,054.1 | 1,416,672.2 |
| Revenue Growth, % | 0 | 16.16 | 20.18 | 3.25 | 5.88 | 11.37 | 11.37 | 11.37 | 11.37 | 11.37 |
| EBITDA | 106,801.0 | 119,327.0 | 144,910.0 | 141,252.0 | 170,342.0 | 177,768.0 | 197,978.2 | 220,486.1 | 245,552.9 | 273,469.5 |
| EBITDA, % | 19.71 | 18.96 | 19.16 | 18.09 | 20.6 | 19.3 | 19.3 | 19.3 | 19.3 | 19.3 |
| Depreciation | 62,459.0 | 59,003.0 | 65,456.0 | 77,163.0 | 85,260.0 | 91,627.4 | 102,044.4 | 113,645.6 | 126,565.9 | 140,955.0 |
| Depreciation, % | 11.53 | 9.37 | 8.65 | 9.88 | 10.31 | 9.95 | 9.95 | 9.95 | 9.95 | 9.95 |
| EBIT | 44,342.0 | 60,324.0 | 79,454.0 | 64,089.0 | 85,082.0 | 86,140.7 | 95,933.9 | 106,840.5 | 118,987.0 | 132,514.5 |
| EBIT, % | 8.18 | 9.58 | 10.5 | 8.21 | 10.29 | 9.35 | 9.35 | 9.35 | 9.35 | 9.35 |
| Total Cash | 192,243.0 | 155,797.0 | 128,576.0 | 134,622.0 | 121,692.0 | 201,109.0 | 223,972.8 | 249,436.0 | 277,794.0 | 309,376.0 |
| Total Cash, percent | .0 | .0 | .0 | .0 | .0 | .0 | .0 | .0 | .0 | .0 |
| Account Receivables | 116,733.0 | 135,325.0 | 156,506.0 | 161,035.0 | 165,630.0 | 192,265.9 | 214,124.4 | 238,467.9 | 265,579.0 | 295,772.3 |
| Account Receivables, % | 21.55 | 21.5 | 20.69 | 20.62 | 20.03 | 20.88 | 20.88 | 20.88 | 20.88 | 20.88 |
| Inventories | 132,628.0 | 157,304.0 | 225,033.0 | 228,027.0 | 256,828.0 | 256,900.9 | 286,107.7 | 318,634.9 | 354,860.0 | 395,203.6 |
| Inventories, % | 24.48 | 24.99 | 29.75 | 29.2 | 31.06 | 27.9 | 27.9 | 27.9 | 27.9 | 27.9 |
| Accounts Payable | 36,161.0 | 49,641.0 | 52,717.0 | 49,124.0 | 59,561.0 | 64,508.8 | 71,842.7 | 80,010.4 | 89,106.7 | 99,237.1 |
| Accounts Payable, % | 6.67 | 7.89 | 6.97 | 6.29 | 7.2 | 7 | 7 | 7 | 7 | 7 |
| Capital Expenditure | -84,915.0 | -70,182.0 | -72,657.0 | -60,551.0 | -71,383.0 | -97,277.3 | -108,336.6 | -120,653.2 | -134,370.2 | -149,646.5 |
| Capital Expenditure, % | -15.67 | -11.15 | -9.61 | -7.75 | -8.63 | -10.56 | -10.56 | -10.56 | -10.56 | -10.56 |
| Tax Rate, % | 40.34 | 40.34 | 40.34 | 40.34 | 40.34 | 40.34 | 40.34 | 40.34 | 40.34 | 40.34 |
| EBITAT | 12,485.9 | 38,294.9 | 55,321.5 | 44,396.7 | 50,758.6 | 49,995.9 | 55,679.9 | 62,010.1 | 69,059.9 | 76,911.2 |
| Depreciation | ||||||||||
| Changes in Account Receivables | ||||||||||
| Changes in Inventories | ||||||||||
| Changes in Accounts Payable | ||||||||||
| Capital Expenditure | ||||||||||
| UFCF | -223,170.1 | -2,672.1 | -37,713.5 | 49,892.7 | 41,676.6 | 22,584.9 | 5,656.4 | 6,299.4 | 7,015.6 | 7,813.2 |
| WACC, % | 3.45 | 3.84 | 3.91 | 3.9 | 3.8 | 3.78 | 3.78 | 3.78 | 3.78 | 3.78 |
| PV UFCF | ||||||||||
| SUM PV UFCF | 45,191.0 | |||||||||
| Long Term Growth Rate, % | 3.00 | |||||||||
| Free cash flow (T + 1) | 8,048 | |||||||||
| Terminal Value | 1,035,410 | |||||||||
| Present Terminal Value | 860,205 | |||||||||
| Enterprise Value | 905,396 | |||||||||
| Net Debt | 126,214 | |||||||||
| Equity Value | 779,182 | |||||||||
| Diluted Shares Outstanding, MM | 330 | |||||||||
| Equity Value Per Share | 2,364.51 |
Benefits You Will Receive
- Authentic KURARAY Financial Data: Pre-loaded with historical and projected performance metrics for precise evaluation.
- Completely Customizable Template: Easily adjust essential inputs such as revenue growth, WACC, and EBITDA percentage.
- Real-Time Calculations: Witness the intrinsic value of Kuraray update immediately in response to your adjustments.
- Expert Valuation Tool: Tailored for investors, analysts, and consultants aiming for accurate DCF outcomes.
- User-Friendly Interface: Intuitive layout and straightforward instructions suitable for users of all skill levels.
Key Features
- 🔍 Real-Life KURARAY Financials: Pre-filled historical and projected data for Kuraray Co., Ltd. (3405T).
- ✏️ Fully Customizable Inputs: Modify all essential parameters (yellow cells) such as WACC, growth %, and tax rates.
- 📊 Professional DCF Valuation: Integrated formulas assess Kuraray’s intrinsic value using the Discounted Cash Flow method.
- ⚡ Instant Results: Visualize Kuraray’s valuation instantly upon making adjustments.
- Scenario Analysis: Evaluate and compare outcomes for different financial assumptions side-by-side.
How It Works
- Step 1: Download the Excel spreadsheet.
- Step 2: Examine Kuraray Co., Ltd.'s pre-filled financial data and projections.
- Step 3: Adjust key inputs such as revenue growth, WACC, and tax rates (highlighted cells).
- Step 4: Observe the DCF model refresh in real-time as you adjust the assumptions.
- Step 5: Evaluate the results and utilize the insights for your investment strategies.
Why Select This Calculator for Kuraray Co., Ltd. (3405T)?
- Precise Insights: Utilize real financial data from Kuraray for trustworthy valuation outcomes.
- Tailorable: Modify essential factors such as growth projections, WACC, and tax rates to align with your forecasts.
- Efficient: Pre-configured calculations save you the hassle of starting from the ground up.
- Expert-Level Tool: Crafted specifically for investors, analysts, and consultants.
- Easy to Use: User-friendly design and clear, step-by-step guidance ensure accessibility for everyone.
Who Can Benefit from This Product?
- Investors: Accurately evaluate the fair value of Kuraray Co., Ltd. (3405T) prior to making investment choices.
- CFOs: Utilize a high-caliber DCF model for comprehensive financial reporting and analysis.
- Consultants: Quickly customize the template for client valuation reports.
- Entrepreneurs: Discover valuable insights into financial modeling practices used by leading corporations.
- Educators: Employ it as an instructional resource to illustrate valuation methodologies.
What the Template Includes
- Pre-Filled Data: Contains Kuraray Co., Ltd.'s historical financials and projected forecasts.
- Discounted Cash Flow Model: Interactive DCF valuation model featuring automatic calculations.
- Weighted Average Cost of Capital (WACC): A specific sheet designed for computing WACC based on user inputs.
- Key Financial Ratios: Assess Kuraray's profitability, efficiency, and financial leverage.
- Customizable Inputs: Easily modify revenue growth, profit margins, and tax rates.
- Clear Dashboard: Visual charts and tables summarizing essential valuation outcomes.
Disclaimer
All information, articles, and product details provided on this website are for general informational and educational purposes only. We do not claim any ownership over, nor do we intend to infringe upon, any trademarks, copyrights, logos, brand names, or other intellectual property mentioned or depicted on this site. Such intellectual property remains the property of its respective owners, and any references here are made solely for identification or informational purposes, without implying any affiliation, endorsement, or partnership.
We make no representations or warranties, express or implied, regarding the accuracy, completeness, or suitability of any content or products presented. Nothing on this website should be construed as legal, tax, investment, financial, medical, or other professional advice. In addition, no part of this site—including articles or product references—constitutes a solicitation, recommendation, endorsement, advertisement, or offer to buy or sell any securities, franchises, or other financial instruments, particularly in jurisdictions where such activity would be unlawful.
All content is of a general nature and may not address the specific circumstances of any individual or entity. It is not a substitute for professional advice or services. Any actions you take based on the information provided here are strictly at your own risk. You accept full responsibility for any decisions or outcomes arising from your use of this website and agree to release us from any liability in connection with your use of, or reliance upon, the content or products found herein.