
|
Sumco Corporation (3436.T) Valoración de DCF |
Completamente Editable: Adáptelo A Sus Necesidades En Excel O Sheets
Diseño Profesional: Plantillas Confiables Y Estándares De La Industria
Predeterminadas Para Un Uso Rápido Y Eficiente
Compatible con MAC / PC, completamente desbloqueado
No Se Necesita Experiencia; Fáciles De Seguir
Sumco Corporation (3436.T) Bundle
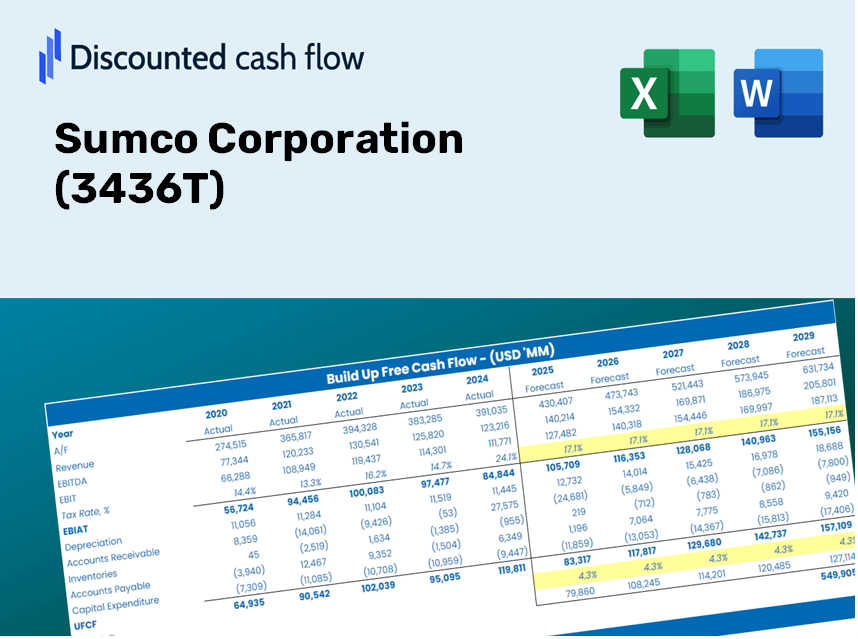
¡Mejore sus estrategias de inversión con la calculadora DCF (3436T)! Utilice datos financieros reales de Sumco Corporation, ajuste las proyecciones y gastos de crecimiento, y observe instantáneamente cómo estos cambios afectan el valor intrínseco de (3436T).
Discounted Cash Flow (DCF) - (USD MM)
| Year | AY1 2020 |
AY2 2021 |
AY3 2022 |
AY4 2023 |
AY5 2024 |
FY1 2025 |
FY2 2026 |
FY3 2027 |
FY4 2028 |
FY5 2029 |
|---|---|---|---|---|---|---|---|---|---|---|
| Revenue | 291,333.0 | 335,674.0 | 441,083.0 | 425,941.0 | 396,619.0 | 432,617.4 | 471,883.1 | 514,712.7 | 561,429.7 | 612,386.8 |
| Revenue Growth, % | 0 | 15.22 | 31.4 | -3.43 | -6.88 | 9.08 | 9.08 | 9.08 | 9.08 | 9.08 |
| EBITDA | 84,668.0 | 104,332.0 | 172,001.0 | 165,432.0 | 114,088.0 | 144,271.9 | 157,366.5 | 171,649.6 | 187,229.1 | 204,222.6 |
| EBITDA, % | 29.06 | 31.08 | 39 | 38.84 | 28.77 | 33.35 | 33.35 | 33.35 | 33.35 | 33.35 |
| Depreciation | 46,770.0 | 52,789.0 | 59,846.0 | 71,582.0 | 78,986.0 | 71,008.5 | 77,453.5 | 84,483.4 | 92,151.4 | 100,515.3 |
| Depreciation, % | 16.05 | 15.73 | 13.57 | 16.81 | 19.91 | 16.41 | 16.41 | 16.41 | 16.41 | 16.41 |
| EBIT | 37,898.0 | 51,543.0 | 112,155.0 | 93,850.0 | 35,102.0 | 73,263.4 | 79,913.0 | 87,166.2 | 95,077.7 | 103,707.2 |
| EBIT, % | 13.01 | 15.36 | 25.43 | 22.03 | 8.85 | 16.93 | 16.93 | 16.93 | 16.93 | 16.93 |
| Total Cash | 82,968.0 | 224,673.0 | 259,305.0 | 156,353.0 | 95,671.0 | 186,049.9 | 202,936.4 | 221,355.5 | 241,446.4 | 263,360.9 |
| Total Cash, percent | .0 | .0 | .0 | .0 | .0 | .0 | .0 | .0 | .0 | .0 |
| Account Receivables | 60,396.0 | 75,579.0 | 89,978.0 | 82,843.0 | 92,537.0 | 92,084.1 | 100,441.9 | 109,558.4 | 119,502.2 | 130,348.6 |
| Account Receivables, % | 20.73 | 22.52 | 20.4 | 19.45 | 23.33 | 21.29 | 21.29 | 21.29 | 21.29 | 21.29 |
| Inventories | 180,472.0 | 174,793.0 | 182,363.0 | 218,396.0 | 233,268.0 | 229,677.9 | 250,524.2 | 273,262.5 | 298,064.7 | 325,118.0 |
| Inventories, % | 61.95 | 52.07 | 41.34 | 51.27 | 58.81 | 53.09 | 53.09 | 53.09 | 53.09 | 53.09 |
| Accounts Payable | 22,223.0 | 25,499.0 | 17,421.0 | 115,630.0 | 32,028.0 | 47,065.5 | 51,337.3 | 55,996.8 | 61,079.3 | 66,623.0 |
| Accounts Payable, % | 7.63 | 7.6 | 3.95 | 27.15 | 8.08 | 10.88 | 10.88 | 10.88 | 10.88 | 10.88 |
| Capital Expenditure | -53,740.0 | -67,786.0 | -125,453.0 | -256,910.0 | -247,248.0 | -164,167.1 | -179,067.4 | -195,320.2 | -213,048.0 | -232,385.0 |
| Capital Expenditure, % | -18.45 | -20.19 | -28.44 | -60.32 | -62.34 | -37.95 | -37.95 | -37.95 | -37.95 | -37.95 |
| Tax Rate, % | 37.18 | 37.18 | 37.18 | 37.18 | 37.18 | 37.18 | 37.18 | 37.18 | 37.18 | 37.18 |
| EBITAT | 27,113.3 | 41,470.8 | 70,719.5 | 64,668.8 | 22,050.5 | 50,812.8 | 55,424.8 | 60,455.3 | 65,942.4 | 71,927.5 |
| Depreciation | ||||||||||
| Changes in Account Receivables | ||||||||||
| Changes in Inventories | ||||||||||
| Changes in Accounts Payable | ||||||||||
| Capital Expenditure | ||||||||||
| UFCF | -198,501.7 | 20,245.8 | -24,934.5 | -51,348.2 | -254,379.5 | -23,265.3 | -71,121.6 | -77,576.8 | -84,617.9 | -92,298.1 |
| WACC, % | 6.08 | 6.2 | 5.96 | 6.04 | 5.96 | 6.05 | 6.05 | 6.05 | 6.05 | 6.05 |
| PV UFCF | ||||||||||
| SUM PV UFCF | -285,939.7 | |||||||||
| Long Term Growth Rate, % | 2.00 | |||||||||
| Free cash flow (T + 1) | -94,144 | |||||||||
| Terminal Value | -2,325,406 | |||||||||
| Present Terminal Value | -1,733,709 | |||||||||
| Enterprise Value | -2,019,649 | |||||||||
| Net Debt | 266,772 | |||||||||
| Equity Value | -2,286,421 | |||||||||
| Diluted Shares Outstanding, MM | 350 | |||||||||
| Equity Value Per Share | -6,538.22 |
What You Will Receive
- Authentic Sumco Data: Preloaded financial information – from revenue to EBIT – derived from actual and forecasted figures.
- Complete Customization: Modify all essential parameters (yellow cells) such as WACC, growth %, and tax rates.
- Immediate Valuation Updates: Automatic recalculations to evaluate the effects of changes on Sumco's fair value.
- Flexible Excel Template: Designed for quick adjustments, scenario analysis, and comprehensive projections.
- Efficient and Precise: Eliminate the need to build models from the ground up while ensuring accuracy and adaptability.
Key Features
- Real-Time SUMCO Data: Pre-loaded with Sumco Corporation's historical financials and future projections.
- Customizable Inputs: Tailor revenue growth, margins, WACC, tax rates, and capital expenditures to fit your analysis.
- Dynamic Valuation Model: Automatically refreshes Net Present Value (NPV) and intrinsic value based on your adjustments.
- Scenario Analysis: Develop various forecasting scenarios to explore different valuation results.
- User-Friendly Interface: Intuitive layout designed for both seasoned professionals and newcomers.
How It Functions
- Download the Template: Gain immediate access to the Excel-based SUMCO DCF Calculator.
- Enter Your Assumptions: Modify the yellow-highlighted cells for growth rates, WACC, profit margins, and more.
- Automatic Calculations: The model promptly updates Sumco Corporation’s intrinsic value.
- Explore Scenarios: Test various assumptions to assess potential changes in valuation.
- Analyze and Make Decisions: Utilize the outcomes to inform your investment or financial analysis.
Why Choose the Sumco Calculator?
- Save Time: Avoid the hassle of building a DCF model from the ground up – it’s ready for immediate use.
- Enhance Accuracy: Trustworthy financial data and formulas help minimize errors in your valuations.
- Fully Customizable: Adapt the model to suit your specific assumptions and forecasts.
- User-Friendly: Intuitive charts and outputs simplify the analysis of results.
- Endorsed by Professionals: Crafted for experts who prioritize accuracy and efficiency.
Who Can Benefit from Sumco Corporation (3436T) Products?
- Investors: Make informed decisions leveraging a high-quality valuation tool tailored for your needs.
- Financial Analysts: Enhance efficiency with a customizable DCF model that’s ready to use.
- Consultants: Easily tweak the template for engaging presentations or comprehensive reports for your clients.
- Finance Enthusiasts: Expand your knowledge of valuation methods through practical, real-world examples.
- Educators and Students: Utilize this resource as a valuable hands-on tool in finance-related courses.
Contents of the Template
- In-Depth DCF Model: A fully editable template featuring intricate valuation calculations.
- Real-Time Data: Sumco Corporation's (3436T) historical and forecasted financials preloaded for immediate analysis.
- Adjustable Parameters: Modify WACC, growth rates, and tax assumptions to explore various scenarios.
- Comprehensive Financial Statements: Detailed annual and quarterly breakdowns for enhanced insights.
- Essential Ratios: Integrated analysis for evaluating profitability, efficiency, and leverage.
- Interactive Dashboard with Visual Outputs: Charts and tables designed for clear, actionable insights.
Disclaimer
All information, articles, and product details provided on this website are for general informational and educational purposes only. We do not claim any ownership over, nor do we intend to infringe upon, any trademarks, copyrights, logos, brand names, or other intellectual property mentioned or depicted on this site. Such intellectual property remains the property of its respective owners, and any references here are made solely for identification or informational purposes, without implying any affiliation, endorsement, or partnership.
We make no representations or warranties, express or implied, regarding the accuracy, completeness, or suitability of any content or products presented. Nothing on this website should be construed as legal, tax, investment, financial, medical, or other professional advice. In addition, no part of this site—including articles or product references—constitutes a solicitation, recommendation, endorsement, advertisement, or offer to buy or sell any securities, franchises, or other financial instruments, particularly in jurisdictions where such activity would be unlawful.
All content is of a general nature and may not address the specific circumstances of any individual or entity. It is not a substitute for professional advice or services. Any actions you take based on the information provided here are strictly at your own risk. You accept full responsibility for any decisions or outcomes arising from your use of this website and agree to release us from any liability in connection with your use of, or reliance upon, the content or products found herein.