
|
Star Asia Investment Corporation (3468.T) Valoración de DCF |
Completamente Editable: Adáptelo A Sus Necesidades En Excel O Sheets
Diseño Profesional: Plantillas Confiables Y Estándares De La Industria
Predeterminadas Para Un Uso Rápido Y Eficiente
Compatible con MAC / PC, completamente desbloqueado
No Se Necesita Experiencia; Fáciles De Seguir
Star Asia Investment Corporation (3468.T) Bundle
¿Busca determinar el valor intrínseco de Star Asia Investment Corporation? Nuestra calculadora DCF (3468T) fusiona datos del mundo real con extensas características de personalización, lo que le permite ajustar los pronósticos y mejorar sus estrategias de inversión.
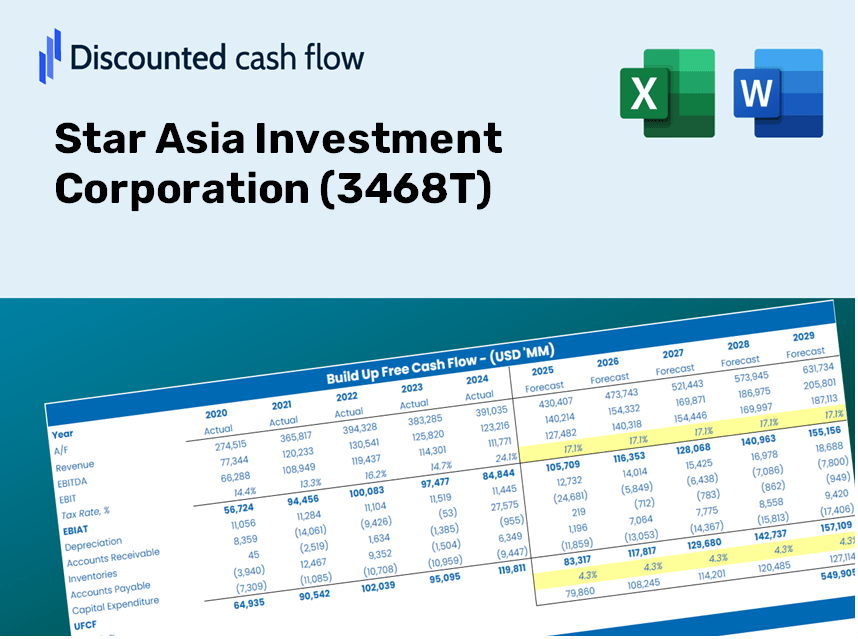
Discounted Cash Flow (DCF) - (USD MM)
| Year | AY1 2020 |
AY2 2021 |
AY3 2022 |
AY4 2023 |
AY5 2024 |
FY1 2025 |
FY2 2026 |
FY3 2027 |
FY4 2028 |
FY5 2029 |
|---|---|---|---|---|---|---|---|---|---|---|
| Revenue | 7,975.3 | 12,232.9 | 12,049.4 | 14,169.0 | 16,078.7 | 19,413.1 | 23,439.0 | 28,299.9 | 34,168.8 | 41,254.8 |
| Revenue Growth, % | 0 | 53.38 | -1.5 | 17.59 | 13.48 | 20.74 | 20.74 | 20.74 | 20.74 | 20.74 |
| EBITDA | 4,502.9 | 7,925.8 | 7,515.5 | 8,463.4 | 10,646.9 | 12,019.5 | 14,512.2 | 17,521.7 | 21,155.4 | 25,542.7 |
| EBITDA, % | 56.46 | 64.79 | 62.37 | 59.73 | 66.22 | 61.91 | 61.91 | 61.91 | 61.91 | 61.91 |
| Depreciation | 852.4 | 1,261.4 | 1,379.8 | 1,507.0 | 1,998.3 | 2,155.5 | 2,602.5 | 3,142.2 | 3,793.8 | 4,580.6 |
| Depreciation, % | 10.69 | 10.31 | 11.45 | 10.64 | 12.43 | 11.1 | 11.1 | 11.1 | 11.1 | 11.1 |
| EBIT | 3,650.4 | 6,664.4 | 6,135.7 | 6,956.4 | 8,648.6 | 9,864.1 | 11,909.7 | 14,379.6 | 17,361.7 | 20,962.2 |
| EBIT, % | 45.77 | 54.48 | 50.92 | 49.1 | 53.79 | 50.81 | 50.81 | 50.81 | 50.81 | 50.81 |
| Total Cash | 1,552.0 | 3,169.7 | 4,265.2 | 3,262.4 | 3,379.0 | 4,845.9 | 5,850.8 | 7,064.2 | 8,529.2 | 10,298.0 |
| Total Cash, percent | .0 | .0 | .0 | .0 | .0 | .0 | .0 | .0 | .0 | .0 |
| Account Receivables | 60.1 | 96.2 | 137.6 | 139.2 | 443.2 | 249.3 | 301.0 | 363.4 | 438.7 | 529.7 |
| Account Receivables, % | 0.75306 | 0.7863 | 1.14 | 0.98228 | 2.76 | 1.28 | 1.28 | 1.28 | 1.28 | 1.28 |
| Inventories | 3,420.7 | 7,413.5 | 8,271.5 | .0 | .0 | 6,683.5 | 8,069.6 | 9,743.1 | 11,763.6 | 14,203.2 |
| Inventories, % | 42.89 | 60.6 | 68.65 | 0 | 0 | 34.43 | 34.43 | 34.43 | 34.43 | 34.43 |
| Accounts Payable | 291.1 | 544.5 | 662.4 | 995.7 | 794.3 | 992.6 | 1,198.5 | 1,447.1 | 1,747.1 | 2,109.5 |
| Accounts Payable, % | 3.65 | 4.45 | 5.5 | 7.03 | 4.94 | 5.11 | 5.11 | 5.11 | 5.11 | 5.11 |
| Capital Expenditure | -3,719.2 | -7,636.4 | -14,064.3 | -16,593.8 | -51,903.8 | -15,882.2 | -19,175.9 | -23,152.7 | -27,954.1 | -33,751.3 |
| Capital Expenditure, % | -46.63 | -62.43 | -116.72 | -117.11 | -322.81 | -81.81 | -81.81 | -81.81 | -81.81 | -81.81 |
| Tax Rate, % | 0.01681009 | 0.01681009 | 0.01681009 | 0.01681009 | 0.01681009 | 0.01681009 | 0.01681009 | 0.01681009 | 0.01681009 | 0.01681009 |
| EBITAT | 3,649.1 | 6,663.8 | 6,134.2 | 6,955.0 | 8,647.2 | 9,862.0 | 11,907.2 | 14,376.5 | 17,358.0 | 20,957.7 |
| Depreciation | ||||||||||
| Changes in Account Receivables | ||||||||||
| Changes in Inventories | ||||||||||
| Changes in Accounts Payable | ||||||||||
| Capital Expenditure | ||||||||||
| UFCF | -2,407.3 | -3,486.8 | -7,331.8 | 471.3 | -41,763.8 | -10,156.1 | -5,898.2 | -7,121.3 | -8,598.2 | -10,381.3 |
| WACC, % | 4.1 | 4.1 | 4.1 | 4.1 | 4.1 | 4.1 | 4.1 | 4.1 | 4.1 | 4.1 |
| PV UFCF | ||||||||||
| SUM PV UFCF | -37,323.7 | |||||||||
| Long Term Growth Rate, % | 3.00 | |||||||||
| Free cash flow (T + 1) | -10,693 | |||||||||
| Terminal Value | -971,215 | |||||||||
| Present Terminal Value | -794,404 | |||||||||
| Enterprise Value | -831,728 | |||||||||
| Net Debt | 118,461 | |||||||||
| Equity Value | -950,189 | |||||||||
| Diluted Shares Outstanding, MM | 2 | |||||||||
| Equity Value Per Share | -400,585.42 |
Your Benefits
- Genuine (3468T) Financial Data: Comprehensive historical and projected metrics for precise valuation.
- Customizable Inputs: Adjust WACC, tax percentages, revenue growth rates, and capital expenditures as needed.
- Automated Calculations: Dynamic calculations for intrinsic value and NPV.
- Scenario Exploration: Analyze various scenarios to assess Star Asia Investment Corporation’s future growth.
- User-Friendly and Clear Design: Tailored for industry professionals while remaining approachable for newcomers.
Key Features
- Authentic Financial Data: Gain access to precise historical figures and future forecasts for Star Asia Investment Corporation (3468T).
- Tailored Forecast Assumptions: Modify the highlighted fields, such as WACC, growth rates, and profit margins, to suit your analysis.
- Automated Calculations: Enjoy real-time updates on DCF, Net Present Value (NPV), and cash flow assessments.
- User-Friendly Dashboard: Effortlessly interpret valuation outcomes with clear charts and summaries.
- Suitable for All Users: Designed with a straightforward layout for both novice and experienced investors, CFOs, and consultants.
How It Works
- Download: Obtain the pre-formatted Excel file containing financial data for Star Asia Investment Corporation (3468T).
- Customize: Modify projections, including revenue growth, EBITDA percentage, and WACC.
- Update Instantly: The calculations for intrinsic value and NPV refresh in real-time.
- Test Scenarios: Generate various projections and compare results immediately.
- Make Informed Choices: Leverage the valuation outcomes to shape your investment approach.
Why Opt for This Calculator from Star Asia Investment Corporation (3468T)?
- Precision: Leverages authentic Star Asia financial data for reliable insights.
- Adaptability: Built for users to freely explore and modify various input parameters.
- Efficiency: Eliminate the tedious process of creating a DCF model from the ground up.
- Expert-Quality: Crafted with the expertise and usability standards of senior financial executives.
- Accessible: Intuitive interface, suitable for users without extensive financial modeling skills.
Who Can Benefit From This Investment Tool?
- Finance Students: Discover valuation methods and apply them to real-time data.
- Academics: Integrate advanced financial models into your research or educational materials.
- Investors: Validate your investment hypotheses and evaluate the valuation results for Star Asia Investment Corporation (3468T).
- Analysts: Enhance your efficiency with a tailored, ready-to-use DCF model.
- Small Business Owners: Understand the analytical approaches used for evaluating large corporations like Star Asia Investment Corporation (3468T).
Contents of the Template
- Pre-Filled Data: Features Star Asia Investment Corporation’s historical financials and projections.
- Discounted Cash Flow Model: An editable DCF valuation model with automatic computations.
- Weighted Average Cost of Capital (WACC): A specific sheet for WACC calculations based on user-defined inputs.
- Key Financial Ratios: Evaluate Star Asia Investment Corporation’s profitability, efficiency, and leverage metrics.
- Customizable Inputs: Easily adjust revenue growth, profit margins, and tax rates.
- User-Friendly Dashboard: Visual representations and tables highlighting key valuation outcomes.
Disclaimer
All information, articles, and product details provided on this website are for general informational and educational purposes only. We do not claim any ownership over, nor do we intend to infringe upon, any trademarks, copyrights, logos, brand names, or other intellectual property mentioned or depicted on this site. Such intellectual property remains the property of its respective owners, and any references here are made solely for identification or informational purposes, without implying any affiliation, endorsement, or partnership.
We make no representations or warranties, express or implied, regarding the accuracy, completeness, or suitability of any content or products presented. Nothing on this website should be construed as legal, tax, investment, financial, medical, or other professional advice. In addition, no part of this site—including articles or product references—constitutes a solicitation, recommendation, endorsement, advertisement, or offer to buy or sell any securities, franchises, or other financial instruments, particularly in jurisdictions where such activity would be unlawful.
All content is of a general nature and may not address the specific circumstances of any individual or entity. It is not a substitute for professional advice or services. Any actions you take based on the information provided here are strictly at your own risk. You accept full responsibility for any decisions or outcomes arising from your use of this website and agree to release us from any liability in connection with your use of, or reliance upon, the content or products found herein.