
|
Komeda Holdings Co., Ltd. (3543.T) Valoración de DCF |
Completamente Editable: Adáptelo A Sus Necesidades En Excel O Sheets
Diseño Profesional: Plantillas Confiables Y Estándares De La Industria
Predeterminadas Para Un Uso Rápido Y Eficiente
Compatible con MAC / PC, completamente desbloqueado
No Se Necesita Experiencia; Fáciles De Seguir
KOMEDA Holdings Co., Ltd. (3543.T) Bundle
¡Evalúe las perspectivas financieras de Komeda Holdings Co., Ltd. con precisión experta! Esta calculadora DCF (3543T) proporciona finanzas precarias, al tiempo que le permite la libertad de modificar el crecimiento de los ingresos, WACC, los márgenes y otros supuestos esenciales para alinearse con sus proyecciones.
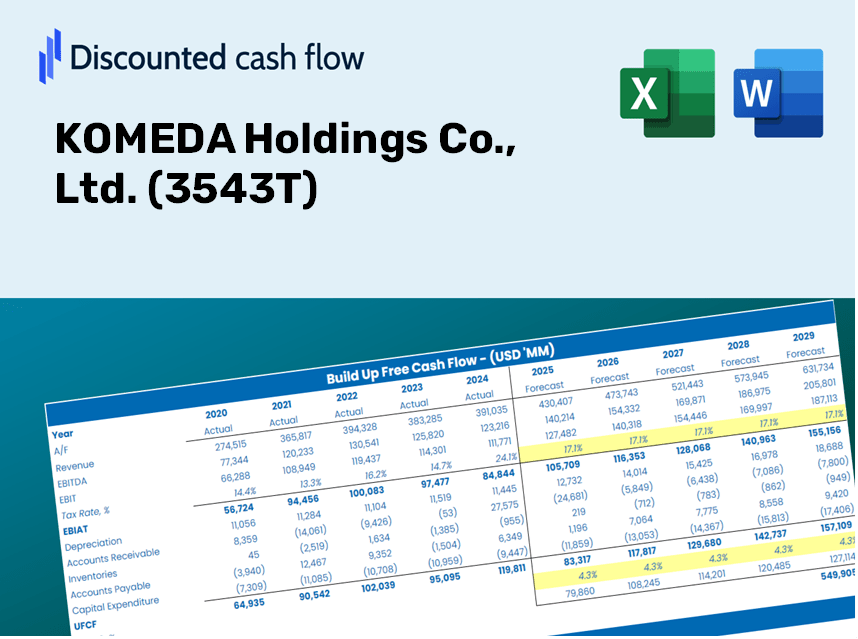
Discounted Cash Flow (DCF) - (USD MM)
| Year | AY1 2020 |
AY2 2021 |
AY3 2022 |
AY4 2023 |
AY5 2024 |
FY1 2025 |
FY2 2026 |
FY3 2027 |
FY4 2028 |
FY5 2029 |
|---|---|---|---|---|---|---|---|---|---|---|
| Revenue | 28,836.0 | 33,317.0 | 37,836.0 | 43,236.0 | 47,057.0 | 49,035.7 | 51,097.7 | 53,246.3 | 55,485.4 | 57,818.5 |
| Revenue Growth, % | 0 | 15.54 | 13.56 | 14.27 | 8.84 | 4.2 | 4.2 | 4.2 | 4.2 | 4.2 |
| EBITDA | 6,959.0 | 8,901.0 | 9,685.0 | 10,348.0 | 10,431.0 | 12,018.4 | 12,523.7 | 13,050.4 | 13,599.1 | 14,171.0 |
| EBITDA, % | 24.13 | 26.72 | 25.6 | 23.93 | 22.17 | 24.51 | 24.51 | 24.51 | 24.51 | 24.51 |
| Depreciation | 1,429.0 | 1,617.0 | 1,609.0 | 1,583.0 | 1,572.0 | 2,065.7 | 2,152.6 | 2,243.1 | 2,337.4 | 2,435.7 |
| Depreciation, % | 4.96 | 4.85 | 4.25 | 3.66 | 3.34 | 4.21 | 4.21 | 4.21 | 4.21 | 4.21 |
| EBIT | 5,530.0 | 7,284.0 | 8,076.0 | 8,765.0 | 8,859.0 | 9,952.6 | 10,371.1 | 10,807.2 | 11,261.7 | 11,735.2 |
| EBIT, % | 19.18 | 21.86 | 21.34 | 20.27 | 18.83 | 20.3 | 20.3 | 20.3 | 20.3 | 20.3 |
| Total Cash | 7,301.0 | 6,205.0 | 6,681.0 | 7,923.0 | 10,390.0 | 10,003.8 | 10,424.5 | 10,862.8 | 11,319.6 | 11,795.6 |
| Total Cash, percent | .0 | .0 | .0 | .0 | .0 | .0 | .0 | .0 | .0 | .0 |
| Account Receivables | 5,195.0 | 5,074.0 | 5,285.0 | 6,054.0 | 7,208.0 | 7,505.7 | 7,821.3 | 8,150.2 | 8,492.9 | 8,850.1 |
| Account Receivables, % | 18.02 | 15.23 | 13.97 | 14 | 15.32 | 15.31 | 15.31 | 15.31 | 15.31 | 15.31 |
| Inventories | 317.0 | 276.0 | 294.0 | 373.0 | 433.0 | 440.1 | 458.6 | 477.9 | 498.0 | 518.9 |
| Inventories, % | 1.1 | 0.82841 | 0.77704 | 0.86271 | 0.92016 | 0.89753 | 0.89753 | 0.89753 | 0.89753 | 0.89753 |
| Accounts Payable | 1,488.0 | 1,524.0 | 2,075.0 | 2,218.0 | 2,789.0 | 2,576.9 | 2,685.2 | 2,798.1 | 2,915.8 | 3,038.4 |
| Accounts Payable, % | 5.16 | 4.57 | 5.48 | 5.13 | 5.93 | 5.26 | 5.26 | 5.26 | 5.26 | 5.26 |
| Capital Expenditure | -1,484.0 | -1,286.0 | -1,269.0 | -1,103.0 | -1,187.0 | -1,709.8 | -1,781.7 | -1,856.6 | -1,934.6 | -2,016.0 |
| Capital Expenditure, % | -5.15 | -3.86 | -3.35 | -2.55 | -2.52 | -3.49 | -3.49 | -3.49 | -3.49 | -3.49 |
| Tax Rate, % | 32.49 | 32.49 | 32.49 | 32.49 | 32.49 | 32.49 | 32.49 | 32.49 | 32.49 | 32.49 |
| EBITAT | 3,682.6 | 5,006.2 | 5,474.8 | 6,027.0 | 5,980.8 | 6,755.5 | 7,039.6 | 7,335.6 | 7,644.1 | 7,965.5 |
| Depreciation | ||||||||||
| Changes in Account Receivables | ||||||||||
| Changes in Inventories | ||||||||||
| Changes in Accounts Payable | ||||||||||
| Capital Expenditure | ||||||||||
| UFCF | -396.4 | 5,535.2 | 6,136.8 | 5,802.0 | 5,722.8 | 6,594.6 | 7,184.8 | 7,486.9 | 7,801.7 | 8,129.8 |
| WACC, % | 4.11 | 4.13 | 4.12 | 4.13 | 4.12 | 4.12 | 4.12 | 4.12 | 4.12 | 4.12 |
| PV UFCF | ||||||||||
| SUM PV UFCF | 32,874.8 | |||||||||
| Long Term Growth Rate, % | 2.00 | |||||||||
| Free cash flow (T + 1) | 8,292 | |||||||||
| Terminal Value | 390,937 | |||||||||
| Present Terminal Value | 319,457 | |||||||||
| Enterprise Value | 352,331 | |||||||||
| Net Debt | 33,593 | |||||||||
| Equity Value | 318,738 | |||||||||
| Diluted Shares Outstanding, MM | 46 | |||||||||
| Equity Value Per Share | 6,995.71 |
What You Will Receive
- Authentic KOMEDA Data: Preloaded financial metrics – from revenue to EBIT – based on real and projected figures.
- Complete Customization: Modify all essential parameters (yellow cells) such as WACC, growth %, and tax rates.
- Instant Valuation Updates: Automatic recalculations for evaluating the effects of changes on KOMEDA’s fair value.
- Flexible Excel Template: Designed for quick modifications, scenario analysis, and detailed forecasting.
- Efficient and Precise: Bypass the need to build models from the ground up while ensuring accuracy and adaptability.
Key Features
- 🔍 Real-Life KOMEDA Financials: Pre-filled historical and projected data for KOMEDA Holdings Co., Ltd. (3543T).
- ✏️ Fully Customizable Inputs: Adjust all essential parameters (yellow cells) such as WACC, growth %, and tax rates.
- 📊 Professional DCF Valuation: Integrated formulas calculate KOMEDA's intrinsic value using the Discounted Cash Flow method.
- ⚡ Instant Results: Visualize KOMEDA’s valuation immediately after making any adjustments.
- Scenario Analysis: Evaluate and compare results for different financial assumptions side-by-side.
How It Works
- Step 1: Download the Excel file for KOMEDA Holdings Co., Ltd. (3543T).
- Step 2: Examine the pre-filled financial data and forecasts for KOMEDA Holdings.
- Step 3: Adjust key inputs such as revenue growth, WACC, and tax rates (highlighted fields).
- Step 4: Observe the DCF model update in real-time as you modify your assumptions.
- Step 5: Evaluate the results and leverage the insights for your investment strategy.
Why Opt for KOMEDA Holdings' Calculator?
- Reliable Data: Utilize accurate KOMEDA financial information for dependable valuation outcomes.
- Flexible Options: Modify essential inputs like growth projections, WACC, and tax rates to align with your forecasts.
- Efficiency Boost: Ready-to-use calculations save you the hassle of starting from the ground up.
- Expert-Level Tool: Tailored for investors, analysts, and consultants in the industry.
- Easy to Use: User-friendly design with clear, step-by-step guidance suitable for all experience levels.
Who Should Consider Using KOMEDA Holdings Co., Ltd. (3543T)?
- Professional Investors: Develop comprehensive and accurate valuation models for portfolio evaluation.
- Corporate Finance Teams: Assess valuation scenarios to inform strategic decision-making.
- Consultants and Advisors: Deliver precise valuation insights to clients regarding KOMEDA Holdings Co., Ltd. (3543T).
- Students and Educators: Utilize real-world data to enhance financial modeling skills and knowledge.
- Culinary Enthusiasts: Gain insights into how companies like KOMEDA Holdings Co., Ltd. (3543T) are valued within the food and beverage industry.
What the Template Includes
- Historical Data: Contains KOMEDA Holdings' past financial performance and baseline forecasts.
- DCF and Levered DCF Models: Comprehensive templates to assess the intrinsic value of KOMEDA Holdings (3543T).
- WACC Sheet: Pre-configured calculations for the Weighted Average Cost of Capital.
- Editable Inputs: Adjust essential parameters such as growth rates, EBITDA %, and CAPEX projections.
- Quarterly and Annual Statements: A detailed analysis of KOMEDA Holdings' financial statements.
- Interactive Dashboard: Dynamically visualize valuation outcomes and forecasts.
Disclaimer
All information, articles, and product details provided on this website are for general informational and educational purposes only. We do not claim any ownership over, nor do we intend to infringe upon, any trademarks, copyrights, logos, brand names, or other intellectual property mentioned or depicted on this site. Such intellectual property remains the property of its respective owners, and any references here are made solely for identification or informational purposes, without implying any affiliation, endorsement, or partnership.
We make no representations or warranties, express or implied, regarding the accuracy, completeness, or suitability of any content or products presented. Nothing on this website should be construed as legal, tax, investment, financial, medical, or other professional advice. In addition, no part of this site—including articles or product references—constitutes a solicitation, recommendation, endorsement, advertisement, or offer to buy or sell any securities, franchises, or other financial instruments, particularly in jurisdictions where such activity would be unlawful.
All content is of a general nature and may not address the specific circumstances of any individual or entity. It is not a substitute for professional advice or services. Any actions you take based on the information provided here are strictly at your own risk. You accept full responsibility for any decisions or outcomes arising from your use of this website and agree to release us from any liability in connection with your use of, or reliance upon, the content or products found herein.