
|
T-Gaia Corporation (3738.T) Valoración de DCF |
Completamente Editable: Adáptelo A Sus Necesidades En Excel O Sheets
Diseño Profesional: Plantillas Confiables Y Estándares De La Industria
Predeterminadas Para Un Uso Rápido Y Eficiente
Compatible con MAC / PC, completamente desbloqueado
No Se Necesita Experiencia; Fáciles De Seguir
T-Gaia Corporation (3738.T) Bundle
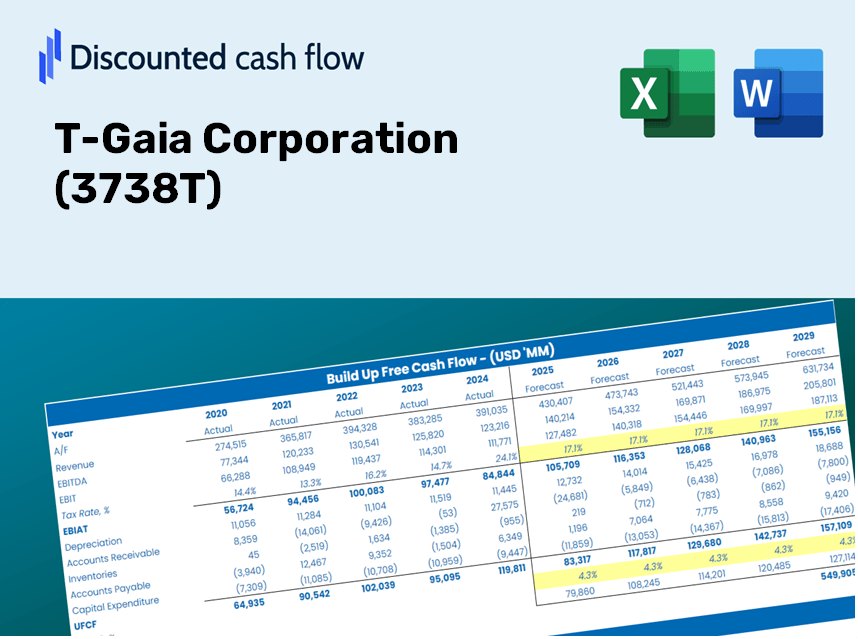
Ingementada para la precisión, nuestra calculadora DCF de T-Gaia Corporation (3738T) le permite evaluar la valoración de T-Gaia utilizando datos financieros del mundo real, al tiempo que ofrece una flexibilidad completa para modificar todos los parámetros esenciales para mejorar las proyecciones.
Benefits You Will Receive
- Comprehensive Financial Model: Utilize T-Gaia Corporation’s actual data for accurate DCF valuation.
- Complete Forecasting Control: Adjust key factors such as revenue growth, margins, WACC, and more.
- Real-Time Calculations: Immediate updates allow you to view results as you modify inputs.
- Professional-Grade Template: A polished Excel file crafted for high-level valuation analysis.
- Flexible and Reusable: Designed for adaptability, enabling ongoing use for detailed projections.
Key Features
- Customizable Forecast Inputs: Adjust essential variables such as revenue growth, EBITDA %, and capital expenditures.
- Instant DCF Valuation: Quickly computes intrinsic value, NPV, and additional financial metrics.
- High-Precision Estimates: Leverages T-Gaia Corporation's (3738T) actual financial data for accurate valuation results.
- Simplified Scenario Analysis: Effortlessly evaluate various assumptions and compare different projections.
- Efficiency Booster: Removes the hassle of developing intricate valuation models from the ground up.
How It Functions
- Step 1: Download the Excel spreadsheet.
- Step 2: Examine T-Gaia Corporation's pre-filled financial data and projections.
- Step 3: Adjust essential inputs such as revenue growth, WACC, and tax rates (highlighted cells).
- Step 4: Observe the DCF model update in real time as you change your assumptions.
- Step 5: Evaluate the results and leverage the findings for investment decisions related to T-Gaia Corporation (3738T).
Why Choose This Calculator for T-Gaia Corporation (3738T)?
- Accurate Data: Utilize real T-Gaia financials for dependable valuation outcomes.
- Customizable: Tailor critical parameters such as growth rates, WACC, and tax rates to align with your forecasts.
- Time-Saving: Pre-configured calculations save you from starting from square one.
- Professional-Grade Tool: Crafted for investors, analysts, and consultants in the T-Gaia sector.
- User-Friendly: Streamlined design and clear, step-by-step guidance make it accessible to all users.
Who Can Benefit from T-Gaia Corporation (3738T)?
- Finance Students: Discover valuation methodologies and apply them with actual market data.
- Academics: Integrate advanced financial models into your teaching or research initiatives.
- Investors: Evaluate your strategies and assess valuation results for T-Gaia Corporation (3738T).
- Analysts: Enhance your efficiency with a pre-designed, customizable DCF model tailored to T-Gaia Corporation (3738T).
- Small Business Owners: Understand how large public corporations like T-Gaia Corporation (3738T) are evaluated and analyzed.
Contents of the Template
- Detailed DCF Model: An editable framework featuring thorough valuation calculations.
- Actual Financial Data: T-Gaia Corporation's (3738T) historical and projected financial metrics preloaded for your analysis.
- Adjustable Variables: Modify WACC, growth assumptions, and tax rates to explore various scenarios.
- Comprehensive Financial Statements: Complete annual and quarterly financial breakdowns for enhanced analysis.
- Essential Ratios: Integrated analysis for assessing profitability, efficiency, and leverage.
- Interactive Dashboard with Visual Representations: Graphs and tables that present clear, actionable insights.
Disclaimer
All information, articles, and product details provided on this website are for general informational and educational purposes only. We do not claim any ownership over, nor do we intend to infringe upon, any trademarks, copyrights, logos, brand names, or other intellectual property mentioned or depicted on this site. Such intellectual property remains the property of its respective owners, and any references here are made solely for identification or informational purposes, without implying any affiliation, endorsement, or partnership.
We make no representations or warranties, express or implied, regarding the accuracy, completeness, or suitability of any content or products presented. Nothing on this website should be construed as legal, tax, investment, financial, medical, or other professional advice. In addition, no part of this site—including articles or product references—constitutes a solicitation, recommendation, endorsement, advertisement, or offer to buy or sell any securities, franchises, or other financial instruments, particularly in jurisdictions where such activity would be unlawful.
All content is of a general nature and may not address the specific circumstances of any individual or entity. It is not a substitute for professional advice or services. Any actions you take based on the information provided here are strictly at your own risk. You accept full responsibility for any decisions or outcomes arising from your use of this website and agree to release us from any liability in connection with your use of, or reliance upon, the content or products found herein.