
|
Pharmaron Beijing Co., Ltd. (3759.hk) Valoración de DCF |
Completamente Editable: Adáptelo A Sus Necesidades En Excel O Sheets
Diseño Profesional: Plantillas Confiables Y Estándares De La Industria
Predeterminadas Para Un Uso Rápido Y Eficiente
Compatible con MAC / PC, completamente desbloqueado
No Se Necesita Experiencia; Fáciles De Seguir
Pharmaron Beijing Co., Ltd. (3759.HK) Bundle
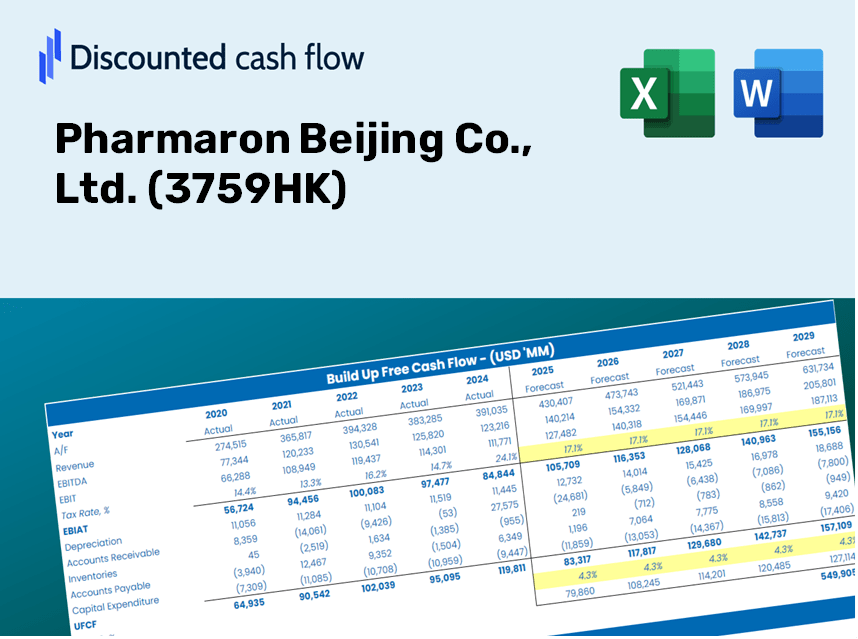
¡Obtenga dominio sobre su análisis de valoración de Pharmaron Beijing Co., Ltd. (3759HK) utilizando nuestra calculadora DCF de última generación! Con datos reales (3759HK) ya integrados, esta plantilla de Excel le permite ajustar preventos y supuestos, lo que permite un cálculo preciso del valor intrínseco de Pharmaron.
Discounted Cash Flow (DCF) - (USD MM)
| Year | AY1 2020 |
AY2 2021 |
AY3 2022 |
AY4 2023 |
AY5 2024 |
FY1 2025 |
FY2 2026 |
FY3 2027 |
FY4 2028 |
FY5 2029 |
|---|---|---|---|---|---|---|---|---|---|---|
| Revenue | 5,608.0 | 8,131.7 | 11,215.1 | 12,604.3 | 13,410.3 | 16,819.9 | 21,096.3 | 26,460.1 | 33,187.6 | 41,625.6 |
| Revenue Growth, % | 0 | 45 | 37.92 | 12.39 | 6.39 | 25.43 | 25.43 | 25.43 | 25.43 | 25.43 |
| EBITDA | 1,877.2 | 2,722.3 | 2,763.7 | 3,219.6 | 3,696.4 | 4,867.7 | 6,105.3 | 7,657.6 | 9,604.6 | 12,046.5 |
| EBITDA, % | 33.47 | 33.48 | 24.64 | 25.54 | 27.56 | 28.94 | 28.94 | 28.94 | 28.94 | 28.94 |
| Depreciation | 409.8 | 543.9 | 760.5 | 1,012.9 | 1,145.6 | 1,256.7 | 1,576.2 | 1,976.9 | 2,479.6 | 3,110.0 |
| Depreciation, % | 7.31 | 6.69 | 6.78 | 8.04 | 8.54 | 7.47 | 7.47 | 7.47 | 7.47 | 7.47 |
| EBIT | 1,467.4 | 2,178.4 | 2,003.2 | 2,206.8 | 2,550.8 | 3,611.0 | 4,529.1 | 5,680.7 | 7,125.0 | 8,936.5 |
| EBIT, % | 26.17 | 26.79 | 17.86 | 17.51 | 19.02 | 21.47 | 21.47 | 21.47 | 21.47 | 21.47 |
| Total Cash | 4,208.4 | 5,569.6 | 2,450.1 | 7,341.3 | 3,064.4 | 8,291.4 | 10,399.5 | 13,043.6 | 16,360.0 | 20,519.6 |
| Total Cash, percent | .0 | .0 | .0 | .0 | .0 | .0 | .0 | .0 | .0 | .0 |
| Account Receivables | 1,322.2 | 1,555.4 | 2,419.1 | 2,880.1 | 3,310.1 | 3,761.2 | 4,717.5 | 5,917.0 | 7,421.4 | 9,308.3 |
| Account Receivables, % | 23.58 | 19.13 | 21.57 | 22.85 | 24.68 | 22.36 | 22.36 | 22.36 | 22.36 | 22.36 |
| Inventories | 307.6 | 742.9 | 1,137.7 | 1,106.7 | 1,219.9 | 1,434.5 | 1,799.2 | 2,256.7 | 2,830.4 | 3,550.1 |
| Inventories, % | 5.49 | 9.14 | 10.14 | 8.78 | 9.1 | 8.53 | 8.53 | 8.53 | 8.53 | 8.53 |
| Accounts Payable | 209.2 | 344.7 | 443.9 | 450.3 | 521.2 | 652.2 | 818.0 | 1,025.9 | 1,286.8 | 1,613.9 |
| Accounts Payable, % | 3.73 | 4.24 | 3.96 | 3.57 | 3.89 | 3.88 | 3.88 | 3.88 | 3.88 | 3.88 |
| Capital Expenditure | -1,437.4 | -2,286.2 | -3,222.5 | -3,130.1 | -2,229.2 | -4,169.2 | -5,229.3 | -6,558.8 | -8,226.4 | -10,318.0 |
| Capital Expenditure, % | -25.63 | -28.12 | -28.73 | -24.83 | -16.62 | -24.79 | -24.79 | -24.79 | -24.79 | -24.79 |
| Tax Rate, % | 14.25 | 14.25 | 14.25 | 14.25 | 14.25 | 14.25 | 14.25 | 14.25 | 14.25 | 14.25 |
| EBITAT | 1,303.9 | 1,893.4 | 1,652.4 | 1,922.5 | 2,187.4 | 3,113.7 | 3,905.4 | 4,898.3 | 6,143.7 | 7,705.8 |
| Depreciation | ||||||||||
| Changes in Account Receivables | ||||||||||
| Changes in Inventories | ||||||||||
| Changes in Accounts Payable | ||||||||||
| Capital Expenditure | ||||||||||
| UFCF | -1,144.4 | -381.8 | -1,968.9 | -618.3 | 631.4 | -333.6 | -902.9 | -1,132.5 | -1,420.4 | -1,781.5 |
| WACC, % | 7.82 | 7.81 | 7.78 | 7.81 | 7.8 | 7.8 | 7.8 | 7.8 | 7.8 | 7.8 |
| PV UFCF | ||||||||||
| SUM PV UFCF | -4,265.5 | |||||||||
| Long Term Growth Rate, % | 2.00 | |||||||||
| Free cash flow (T + 1) | -1,817 | |||||||||
| Terminal Value | -31,311 | |||||||||
| Present Terminal Value | -21,504 | |||||||||
| Enterprise Value | -25,770 | |||||||||
| Net Debt | 4,210 | |||||||||
| Equity Value | -29,980 | |||||||||
| Diluted Shares Outstanding, MM | 1,787 | |||||||||
| Equity Value Per Share | -16.77 |
What You Will Receive
- Genuine Pharmaron Data: Comprehensive financials – encompassing revenue to EBIT – derived from actual and projected metrics.
- Comprehensive Customization: Fine-tune all essential parameters (yellow cells) such as WACC, growth %, and tax rates.
- Immediate Valuation Adjustments: Automatic recalculations to evaluate the effects of modifications on Pharmaron’s fair value.
- Flexible Excel Template: Designed for quick modifications, scenario analysis, and in-depth forecasts.
- Efficient and Precise: Avoid the hassle of creating models from scratch while ensuring accuracy and adaptability.
Key Features
- Customizable Forecast Inputs: Adjust essential factors such as revenue growth, EBITDA margin, and capital investments.
- Instant DCF Valuation: Automatically determines intrinsic value, net present value, and other key metrics.
- High-Precision Analysis: Leverages Pharmaron’s actual financial data for credible valuation results.
- Streamlined Scenario Testing: Easily evaluate various assumptions and analyze their impact on outcomes.
- Efficiency-Boosting Tool: Remove the hassle of constructing intricate valuation models from the ground up.
How It Works
- Download: Obtain the ready-to-use Excel file containing Pharmaron Beijing Co., Ltd. (3759HK) financial data.
- Customize: Modify forecasts such as revenue growth, EBITDA %, and WACC to fit your analysis.
- Update Automatically: Real-time updates for intrinsic value and NPV calculations as you adjust your inputs.
- Test Scenarios: Generate various projections and instantly compare the results.
- Make Decisions: Leverage the valuation outcomes to inform your investment strategy for Pharmaron Beijing Co., Ltd. (3759HK).
Why Opt for Pharmaron Beijing Co., Ltd. (3759HK)?
- Precision: Leverage actual Pharmaron financial data for reliable results.
- Adaptability: Tailored for users to easily adjust and experiment with inputs.
- Efficiency: Eliminate the need to create complex financial models from the ground up.
- Expert-Level: Crafted with the expertise and accuracy expected by top-tier financial professionals.
- Accessible: Intuitive interface designed for users of all financial backgrounds.
Who Can Benefit from This Product?
- Professional Investors: Develop intricate and trustworthy valuation models for assessing portfolios, specifically for Pharmaron Beijing Co., Ltd. (3759HK).
- Corporate Finance Teams: Evaluate financial scenarios to inform strategic decisions within their organizations.
- Consultants and Advisors: Deliver precise valuation analyses for clients interested in Pharmaron Beijing Co., Ltd. (3759HK).
- Students and Educators: Utilize authentic market data to enhance learning experiences in financial modeling.
- Life Sciences Enthusiasts: Gain insights into how pharmaceutical companies like Pharmaron Beijing Co., Ltd. (3759HK) are valued in the investment landscape.
Contents of the Template
- Preloaded 3759HK Data: Historical and projected financial figures, including revenue, EBIT, and capital expenditures.
- DCF and WACC Models: Advanced sheets for determining intrinsic value and Weighted Average Cost of Capital.
- Editable Inputs: Yellow-highlighted cells for modifying revenue growth, tax rates, and discount rates.
- Financial Statements: Detailed annual and quarterly financials for in-depth analysis.
- Key Ratios: Profitability, leverage, and efficiency ratios for performance evaluation.
- Dashboard and Charts: Visual representations of valuation results and underlying assumptions.
Disclaimer
All information, articles, and product details provided on this website are for general informational and educational purposes only. We do not claim any ownership over, nor do we intend to infringe upon, any trademarks, copyrights, logos, brand names, or other intellectual property mentioned or depicted on this site. Such intellectual property remains the property of its respective owners, and any references here are made solely for identification or informational purposes, without implying any affiliation, endorsement, or partnership.
We make no representations or warranties, express or implied, regarding the accuracy, completeness, or suitability of any content or products presented. Nothing on this website should be construed as legal, tax, investment, financial, medical, or other professional advice. In addition, no part of this site—including articles or product references—constitutes a solicitation, recommendation, endorsement, advertisement, or offer to buy or sell any securities, franchises, or other financial instruments, particularly in jurisdictions where such activity would be unlawful.
All content is of a general nature and may not address the specific circumstances of any individual or entity. It is not a substitute for professional advice or services. Any actions you take based on the information provided here are strictly at your own risk. You accept full responsibility for any decisions or outcomes arising from your use of this website and agree to release us from any liability in connection with your use of, or reliance upon, the content or products found herein.