
|
Sumitomo Chemical Company, Limited (4005.T) Valoración de DCF |
Completamente Editable: Adáptelo A Sus Necesidades En Excel O Sheets
Diseño Profesional: Plantillas Confiables Y Estándares De La Industria
Predeterminadas Para Un Uso Rápido Y Eficiente
Compatible con MAC / PC, completamente desbloqueado
No Se Necesita Experiencia; Fáciles De Seguir
Sumitomo Chemical Company, Limited (4005.T) Bundle
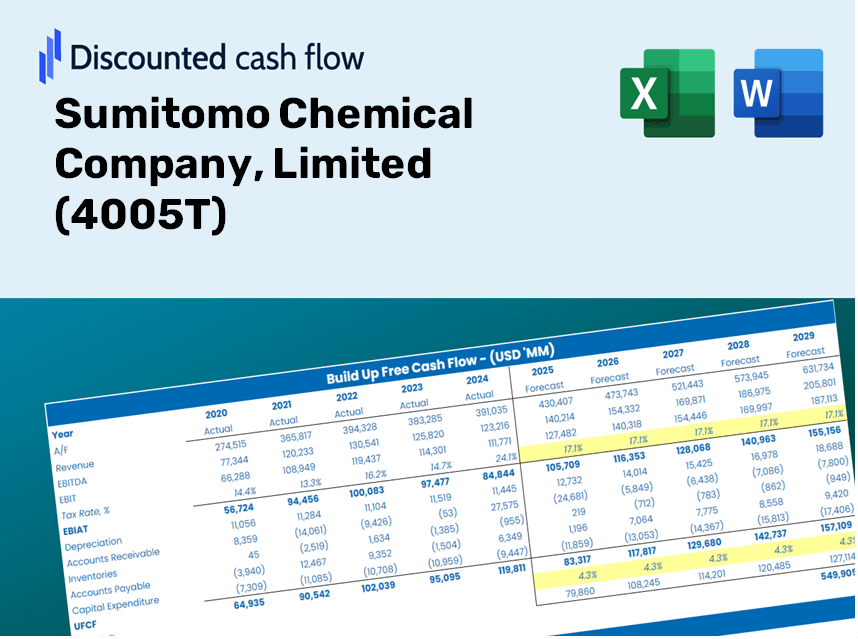
¡Maximice la eficiencia y mejore la precisión con nuestra calculadora DCF (4005T)! Utilizando datos reales de Sumitomo Chemical Company, supuestos limitados y personalizables, esta herramienta le permite pronosticar, analizar y valor (4005T) como un inversor experimentado.
Discounted Cash Flow (DCF) - (USD MM)
| Year | AY1 2021 |
AY2 2022 |
AY3 2023 |
AY4 2024 |
AY5 2025 |
FY1 2026 |
FY2 2027 |
FY3 2028 |
FY4 2029 |
FY5 2030 |
|---|---|---|---|---|---|---|---|---|---|---|
| Revenue | 2,286,978.0 | 2,765,321.0 | 2,895,283.0 | 2,446,893.0 | 2,606,281.0 | 2,714,719.4 | 2,827,669.6 | 2,945,319.2 | 3,067,863.9 | 3,195,507.2 |
| Revenue Growth, % | 0 | 20.92 | 4.7 | -15.49 | 6.51 | 4.16 | 4.16 | 4.16 | 4.16 | 4.16 |
| EBITDA | 306,281.0 | 388,684.0 | 199,078.0 | -258,307.0 | 321,641.0 | 196,048.6 | 204,205.5 | 212,701.8 | 221,551.6 | 230,769.6 |
| EBITDA, % | 13.39 | 14.06 | 6.88 | -10.56 | 12.34 | 7.22 | 7.22 | 7.22 | 7.22 | 7.22 |
| Depreciation | 136,017.0 | 156,667.0 | 167,957.0 | 157,522.0 | 131,597.0 | 156,915.1 | 163,443.8 | 170,244.1 | 177,327.4 | 184,705.4 |
| Depreciation, % | 5.95 | 5.67 | 5.8 | 6.44 | 5.05 | 5.78 | 5.78 | 5.78 | 5.78 | 5.78 |
| EBIT | 170,264.0 | 232,017.0 | 31,121.0 | -415,829.0 | 190,044.0 | 39,133.6 | 40,761.8 | 42,457.7 | 44,224.3 | 46,064.3 |
| EBIT, % | 7.44 | 8.39 | 1.07 | -16.99 | 7.29 | 1.44 | 1.44 | 1.44 | 1.44 | 1.44 |
| Total Cash | 360,918.0 | 389,420.0 | 305,844.0 | 217,449.0 | 209,838.0 | 311,460.9 | 324,419.8 | 337,917.8 | 351,977.4 | 366,621.9 |
| Total Cash, percent | .0 | .0 | .0 | .0 | .0 | .0 | .0 | .0 | .0 | .0 |
| Account Receivables | 652,616.0 | 720,422.0 | 603,161.0 | 620,022.0 | 593,836.0 | 670,778.3 | 698,687.1 | 727,757.1 | 758,036.6 | 789,575.9 |
| Account Receivables, % | 28.54 | 26.05 | 20.83 | 25.34 | 22.78 | 24.71 | 24.71 | 24.71 | 24.71 | 24.71 |
| Inventories | 511,529.0 | 651,358.0 | 744,474.0 | 709,637.0 | 625,243.0 | 676,650.8 | 704,804.0 | 734,128.4 | 764,673.0 | 796,488.4 |
| Inventories, % | 22.37 | 23.55 | 25.71 | 29 | 23.99 | 24.93 | 24.93 | 24.93 | 24.93 | 24.93 |
| Accounts Payable | 522,887.0 | 551,583.0 | 515,865.0 | 543,384.0 | 488,132.0 | 551,433.9 | 574,377.1 | 598,275.0 | 623,167.2 | 649,095.0 |
| Accounts Payable, % | 22.86 | 19.95 | 17.82 | 22.21 | 18.73 | 20.31 | 20.31 | 20.31 | 20.31 | 20.31 |
| Capital Expenditure | -120,812.0 | -107,467.0 | -143,581.0 | -152,873.0 | -130,465.0 | -137,806.8 | -143,540.5 | -149,512.7 | -155,733.4 | -162,212.9 |
| Capital Expenditure, % | -5.28 | -3.89 | -4.96 | -6.25 | -5.01 | -5.08 | -5.08 | -5.08 | -5.08 | -5.08 |
| Tax Rate, % | -3.04 | -3.04 | -3.04 | -3.04 | -3.04 | -3.04 | -3.04 | -3.04 | -3.04 | -3.04 |
| EBITAT | 56,888.9 | 149,787.0 | 941,309.2 | -280,193.4 | 195,813.2 | 28,595.1 | 29,784.9 | 31,024.1 | 32,314.9 | 33,659.4 |
| Depreciation | ||||||||||
| Changes in Account Receivables | ||||||||||
| Changes in Inventories | ||||||||||
| Changes in Accounts Payable | ||||||||||
| Capital Expenditure | ||||||||||
| UFCF | -569,164.1 | 20,048.0 | 954,112.2 | -230,049.4 | 252,273.2 | -17,344.9 | 16,569.5 | 17,258.9 | 17,977.0 | 18,725.0 |
| WACC, % | 4.46 | 6.8 | 9.46 | 7.01 | 9.46 | 7.44 | 7.44 | 7.44 | 7.44 | 7.44 |
| PV UFCF | ||||||||||
| SUM PV UFCF | 38,697.2 | |||||||||
| Long Term Growth Rate, % | 2.00 | |||||||||
| Free cash flow (T + 1) | 19,099 | |||||||||
| Terminal Value | 351,096 | |||||||||
| Present Terminal Value | 245,243 | |||||||||
| Enterprise Value | 283,940 | |||||||||
| Net Debt | 1,076,290 | |||||||||
| Equity Value | -792,350 | |||||||||
| Diluted Shares Outstanding, MM | 1,637 | |||||||||
| Equity Value Per Share | -484.17 |
Benefits You Will Receive
- Pre-Filled Financial Model: Utilize actual data from Sumitomo Chemical Company, Limited (4005T) for accurate DCF valuation.
- Comprehensive Forecast Control: Modify revenue growth, profit margins, WACC, and other essential parameters.
- Real-Time Calculations: Automatic updates provide immediate insights as adjustments are made.
- Professional-Grade Template: A polished Excel file crafted for high-quality valuation presentations.
- Flexible and Reusable: Designed for adaptability, allowing repeated application for in-depth forecasts.
Key Features
- Comprehensive Sumitomo Financials: Gain access to precise pre-loaded historical data and forward-looking projections for Sumitomo Chemical Company, Limited (4005T).
- Customizable Forecast Parameters: Modify highlighted fields such as WACC, growth rates, and margins to tailor your analysis.
- Real-Time Calculations: Automatic updates for DCF, Net Present Value (NPV), and cash flow assessments.
- Interactive Dashboard: User-friendly charts and summaries to effectively visualize your valuation findings.
- Designed for All Skill Levels: An intuitive layout crafted for investors, CFOs, and consultants alike.
How It Functions
- Step 1: Download the Excel spreadsheet.
- Step 2: Examine Sumitomo Chemical's pre-filled financial data and projections.
- Step 3: Adjust key variables such as revenue growth, WACC, and tax rates (highlighted cells).
- Step 4: Observe the DCF model refresh instantly as you modify your assumptions.
- Step 5: Evaluate the results and leverage them for investment decisions regarding Sumitomo Chemical Company, Limited (4005T).
Why Choose This Calculator for Sumitomo Chemical Company, Limited (4005T)?
- Reliable Data: Utilize authentic Sumitomo Chemical financials to achieve trustworthy valuation outcomes.
- Customizable Options: Tailor essential variables such as growth rates, WACC, and tax rates to reflect your forecasts.
- Efficient: Pre-configured calculations save you the effort of building from the ground up.
- Professional-Quality Tool: Crafted for use by investors, analysts, and consultants alike.
- Easy to Use: An intuitive design and clear, step-by-step guidance ensure accessibility for all users.
Who Can Benefit from This Product?
- Investors: Assess Sumitomo Chemical's valuation before making stock transactions.
- CFOs and Financial Analysts: Enhance the efficiency of valuation processes and evaluate financial projections.
- Startup Founders: Discover how established companies like Sumitomo Chemical ([4005T]) are valued in the market.
- Consultants: Create comprehensive valuation reports for your clients.
- Students and Educators: Utilize real-world examples to practice and teach valuation methods.
Contents of the Template
- Operating and Balance Sheet Data: Pre-filled historical data and forecasts for Sumitomo Chemical Company, Limited (4005T), including revenue, EBITDA, EBIT, and capital expenditures.
- WACC Calculation: A dedicated sheet for calculating the Weighted Average Cost of Capital (WACC), featuring parameters such as Beta, risk-free rate, and share price.
- DCF Valuation (Unlevered and Levered): Editable Discounted Cash Flow models displaying intrinsic value with comprehensive calculations.
- Financial Statements: Pre-loaded financial statements (both annual and quarterly) to facilitate thorough analysis.
- Key Ratios: Covers profitability, leverage, and efficiency ratios for Sumitomo Chemical Company, Limited (4005T).
- Dashboard and Charts: Visual overview of valuation outputs and assumptions designed for easy result analysis.
Disclaimer
All information, articles, and product details provided on this website are for general informational and educational purposes only. We do not claim any ownership over, nor do we intend to infringe upon, any trademarks, copyrights, logos, brand names, or other intellectual property mentioned or depicted on this site. Such intellectual property remains the property of its respective owners, and any references here are made solely for identification or informational purposes, without implying any affiliation, endorsement, or partnership.
We make no representations or warranties, express or implied, regarding the accuracy, completeness, or suitability of any content or products presented. Nothing on this website should be construed as legal, tax, investment, financial, medical, or other professional advice. In addition, no part of this site—including articles or product references—constitutes a solicitation, recommendation, endorsement, advertisement, or offer to buy or sell any securities, franchises, or other financial instruments, particularly in jurisdictions where such activity would be unlawful.
All content is of a general nature and may not address the specific circumstances of any individual or entity. It is not a substitute for professional advice or services. Any actions you take based on the information provided here are strictly at your own risk. You accept full responsibility for any decisions or outcomes arising from your use of this website and agree to release us from any liability in connection with your use of, or reliance upon, the content or products found herein.