
|
Tosoh Corporation (4042.T) DCF Valoración |
Completamente Editable: Adáptelo A Sus Necesidades En Excel O Sheets
Diseño Profesional: Plantillas Confiables Y Estándares De La Industria
Predeterminadas Para Un Uso Rápido Y Eficiente
Compatible con MAC / PC, completamente desbloqueado
No Se Necesita Experiencia; Fáciles De Seguir
Tosoh Corporation (4042.T) Bundle
¡Evalúe el futuro financiero de Tosoh Corporation como un profesional! Esta calculadora DCF (4042T) viene con datos financieros previamente llenos y ofrece una flexibilidad total para modificar el crecimiento de los ingresos, WACC, los márgenes y otros supuestos esenciales para alinearse con sus proyecciones.
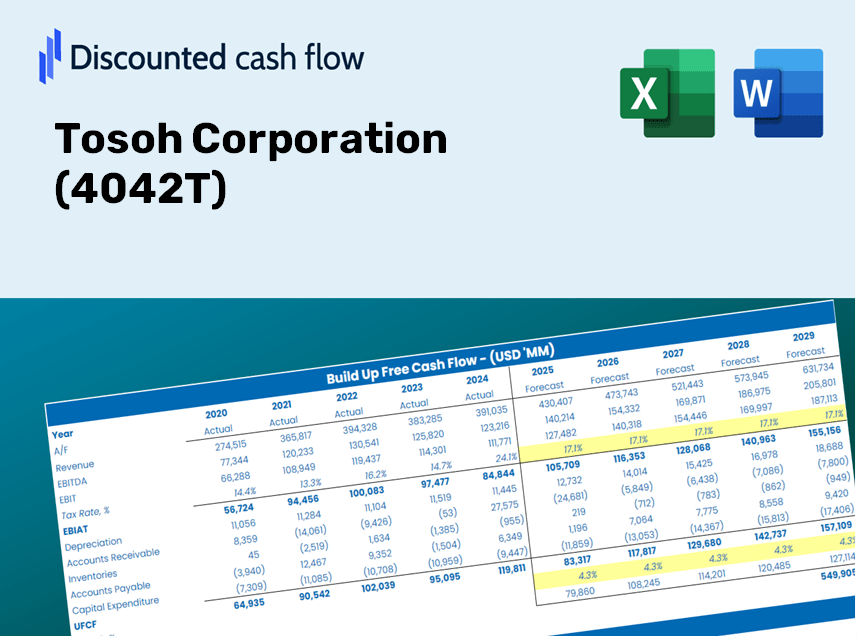
Discounted Cash Flow (DCF) - (USD MM)
| Year | AY1 2021 |
AY2 2022 |
AY3 2023 |
AY4 2024 |
AY5 2025 |
FY1 2026 |
FY2 2027 |
FY3 2028 |
FY4 2029 |
FY5 2030 |
|---|---|---|---|---|---|---|---|---|---|---|
| Revenue | 732,850.0 | 918,580.0 | 1,064,376.0 | 1,005,640.0 | 1,063,382.0 | 1,173,545.4 | 1,295,121.4 | 1,429,292.3 | 1,577,363.0 | 1,740,773.4 |
| Revenue Growth, % | 0 | 25.34 | 15.87 | -5.52 | 5.74 | 10.36 | 10.36 | 10.36 | 10.36 | 10.36 |
| EBITDA | 136,858.0 | 201,398.0 | 126,105.0 | 140,479.0 | 151,692.0 | 189,367.1 | 208,985.0 | 230,635.3 | 254,528.5 | 280,896.9 |
| EBITDA, % | 18.67 | 21.92 | 11.85 | 13.97 | 14.27 | 16.14 | 16.14 | 16.14 | 16.14 | 16.14 |
| Depreciation | 40,462.0 | 40,663.0 | 43,062.0 | 44,511.0 | 47,508.0 | 53,718.9 | 59,284.0 | 65,425.7 | 72,203.6 | 79,683.7 |
| Depreciation, % | 5.52 | 4.43 | 4.05 | 4.43 | 4.47 | 4.58 | 4.58 | 4.58 | 4.58 | 4.58 |
| EBIT | 96,396.0 | 160,735.0 | 83,043.0 | 95,968.0 | 104,184.0 | 135,648.3 | 149,701.1 | 165,209.7 | 182,324.9 | 201,213.3 |
| EBIT, % | 13.15 | 17.5 | 7.8 | 9.54 | 9.8 | 11.56 | 11.56 | 11.56 | 11.56 | 11.56 |
| Total Cash | 149,165.0 | 161,516.0 | 120,153.0 | 149,812.0 | 141,548.0 | 181,745.1 | 200,573.4 | 221,352.2 | 244,283.7 | 269,590.8 |
| Total Cash, percent | .0 | .0 | .0 | .0 | .0 | .0 | .0 | .0 | .0 | .0 |
| Account Receivables | 234,584.0 | 234,584.0 | 259,630.0 | 294,812.0 | 330,582.0 | 334,093.9 | 368,705.1 | 406,901.9 | 449,055.8 | 495,576.8 |
| Account Receivables, % | 32.01 | 25.54 | 24.39 | 29.32 | 31.09 | 28.47 | 28.47 | 28.47 | 28.47 | 28.47 |
| Inventories | 155,564.0 | 191,663.0 | 257,130.0 | 255,251.0 | 247,823.0 | 269,768.4 | 297,715.6 | 328,558.1 | 362,595.8 | 400,159.7 |
| Inventories, % | 21.23 | 20.87 | 24.16 | 25.38 | 23.31 | 22.99 | 22.99 | 22.99 | 22.99 | 22.99 |
| Accounts Payable | 91,377.0 | 113,441.0 | 122,903.0 | 122,149.0 | 117,523.0 | 139,800.9 | 154,283.9 | 170,267.3 | 187,906.5 | 207,373.1 |
| Accounts Payable, % | 12.47 | 12.35 | 11.55 | 12.15 | 11.05 | 11.91 | 11.91 | 11.91 | 11.91 | 11.91 |
| Capital Expenditure | -50,151.0 | -44,482.0 | -79,621.0 | -58,713.0 | -79,897.0 | -76,323.0 | -84,229.9 | -92,955.9 | -102,585.8 | -113,213.4 |
| Capital Expenditure, % | -6.84 | -4.84 | -7.48 | -5.84 | -7.51 | -6.5 | -6.5 | -6.5 | -6.5 | -6.5 |
| Tax Rate, % | 42.82 | 42.82 | 42.82 | 42.82 | 42.82 | 42.82 | 42.82 | 42.82 | 42.82 | 42.82 |
| EBITAT | 64,164.6 | 108,657.9 | 51,215.7 | 58,698.4 | 59,576.1 | 85,237.6 | 94,068.0 | 103,813.1 | 114,567.9 | 126,436.8 |
| Depreciation | ||||||||||
| Changes in Account Receivables | ||||||||||
| Changes in Inventories | ||||||||||
| Changes in Accounts Payable | ||||||||||
| Capital Expenditure | ||||||||||
| UFCF | -244,295.4 | 90,803.9 | -66,394.3 | 10,439.4 | -5,780.9 | 59,454.0 | 21,046.6 | 23,227.0 | 25,633.2 | 28,288.8 |
| WACC, % | 6.23 | 6.24 | 6.19 | 6.19 | 6.16 | 6.2 | 6.2 | 6.2 | 6.2 | 6.2 |
| PV UFCF | ||||||||||
| SUM PV UFCF | 135,124.5 | |||||||||
| Long Term Growth Rate, % | 3.00 | |||||||||
| Free cash flow (T + 1) | 29,137 | |||||||||
| Terminal Value | 910,233 | |||||||||
| Present Terminal Value | 673,763 | |||||||||
| Enterprise Value | 808,888 | |||||||||
| Net Debt | 37,556 | |||||||||
| Equity Value | 771,332 | |||||||||
| Diluted Shares Outstanding, MM | 319 | |||||||||
| Equity Value Per Share | 2,421.73 |
What You Will Receive
- Genuine Tosoh Data: Preloaded financial metrics – covering everything from revenue to EBIT – sourced from actual and projected figures.
- Comprehensive Customization: Modify all essential variables (highlighted in yellow) such as WACC, growth percentages, and tax rates.
- Immediate Valuation Adjustments: Automated recalculations to evaluate the effects of changes on Tosoh's fair value.
- Flexible Excel Template: Designed for quick modifications, scenario analysis, and in-depth projections.
- Efficient and Reliable: Avoid the hassle of creating models from the ground up while ensuring accuracy and adaptability.
Key Features
- Authentic Tosoh Financials: Gain access to precise historical data and future forecasts specific to Tosoh Corporation.
- Adjustable Forecast Parameters: Modify the highlighted fields such as WACC, growth rates, and profit margins to suit your analysis.
- Real-Time Calculations: Automatic recalculations for DCF, Net Present Value (NPV), and cash flow assessments.
- User-Friendly Dashboard: Clear visuals and summaries to help you interpret your valuation outcomes effortlessly.
- Designed for All Skill Levels: An intuitive layout catered to investors, CFOs, and consultants, whether seasoned or novice.
How It Operates
- 1. Access the Template: Download and open the Excel file containing Tosoh Corporation's (4042T) preloaded data.
- 2. Adjust Assumptions: Modify essential inputs such as growth projections, WACC, and capital expenditures.
- 3. View Results Instantly: The DCF model automatically calculates the intrinsic value and NPV.
- 4. Experiment with Scenarios: Evaluate different forecasts to assess various valuation results.
- 5. Utilize with Assurance: Present expert valuation insights to inform your strategic decisions.
Why Select This Calculator for Tosoh Corporation (4042T)?
- Precision: Utilizes authentic Tosoh financial data to guarantee accuracy.
- Versatility: Built to allow users to effortlessly modify and test inputs.
- Efficiency: Eliminate the need to construct a DCF model from the ground up.
- High-Quality Standards: Crafted with the precision and usability expected at the CFO level.
- Intuitive Interface: Simple and accessible for users with varying levels of financial modeling expertise.
Who Can Benefit from This Product?
- Institutional Investors: Create comprehensive and accurate valuation models for portfolio evaluation related to Tosoh Corporation (4042T).
- Finance Departments: Evaluate valuation scenarios to inform corporate strategy for Tosoh Corporation (4042T).
- Financial Consultants: Offer clients precise valuation analyses for Tosoh Corporation (4042T) stock.
- Students and Instructors: Utilize real-world data to enhance financial modeling skills and education.
- Industry Analysts: Gain insights into how companies like Tosoh Corporation (4042T) are valued within the marketplace.
What the Template Includes
- In-Depth DCF Model: Editable template featuring comprehensive valuation calculations.
- Current Data: Tosoh Corporation’s historical and projected financials preloaded for thorough analysis.
- Adjustable Parameters: Modify WACC, growth rates, and tax assumptions to explore different scenarios.
- Financial Statements: Complete annual and quarterly breakdowns for enhanced insights.
- Essential Ratios: Integrated analysis for profitability, efficiency, and financial leverage.
- Dashboard with Visual Presentations: Charts and tables providing clear, actionable insights.
Disclaimer
All information, articles, and product details provided on this website are for general informational and educational purposes only. We do not claim any ownership over, nor do we intend to infringe upon, any trademarks, copyrights, logos, brand names, or other intellectual property mentioned or depicted on this site. Such intellectual property remains the property of its respective owners, and any references here are made solely for identification or informational purposes, without implying any affiliation, endorsement, or partnership.
We make no representations or warranties, express or implied, regarding the accuracy, completeness, or suitability of any content or products presented. Nothing on this website should be construed as legal, tax, investment, financial, medical, or other professional advice. In addition, no part of this site—including articles or product references—constitutes a solicitation, recommendation, endorsement, advertisement, or offer to buy or sell any securities, franchises, or other financial instruments, particularly in jurisdictions where such activity would be unlawful.
All content is of a general nature and may not address the specific circumstances of any individual or entity. It is not a substitute for professional advice or services. Any actions you take based on the information provided here are strictly at your own risk. You accept full responsibility for any decisions or outcomes arising from your use of this website and agree to release us from any liability in connection with your use of, or reliance upon, the content or products found herein.