
|
Appier Group, Inc. (4180.T) Valoración de DCF |
Completamente Editable: Adáptelo A Sus Necesidades En Excel O Sheets
Diseño Profesional: Plantillas Confiables Y Estándares De La Industria
Predeterminadas Para Un Uso Rápido Y Eficiente
Compatible con MAC / PC, completamente desbloqueado
No Se Necesita Experiencia; Fáciles De Seguir
Appier Group, Inc. (4180.T) Bundle
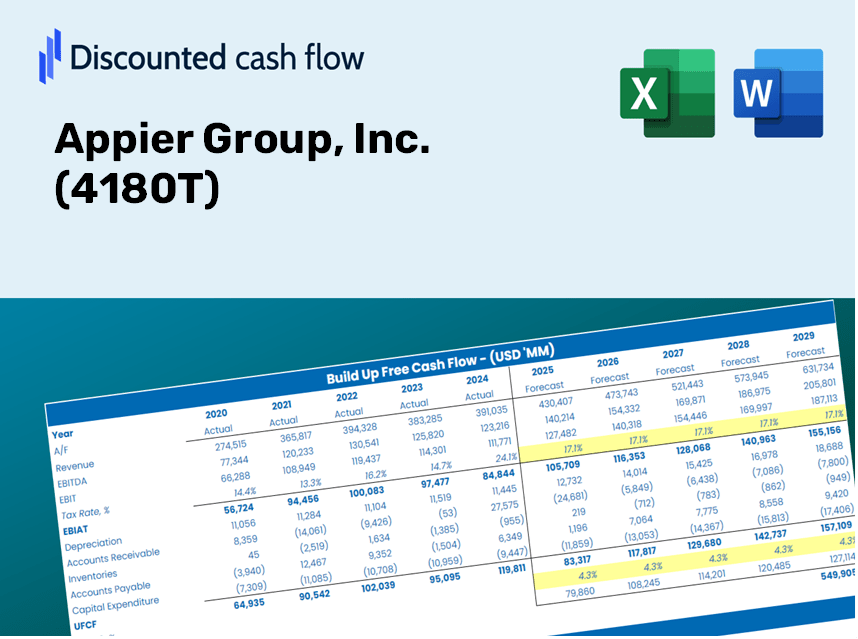
¡Evaluar las perspectivas financieras de Apier Group, Inc. como un experto! Esta calculadora DCF (4180T) le proporciona datos financieros previamente llenos y flexibilidad total para modificar el crecimiento de los ingresos, WACC, los márgenes y otros supuestos esenciales para alinearse con sus predicciones.
Discounted Cash Flow (DCF) - (USD MM)
| Year | AY1 2020 |
AY2 2021 |
AY3 2022 |
AY4 2023 |
AY5 2024 |
FY1 2025 |
FY2 2026 |
FY3 2027 |
FY4 2028 |
FY5 2029 |
|---|---|---|---|---|---|---|---|---|---|---|
| Revenue | 8,970.1 | 12,660.8 | 19,426.6 | 26,418.0 | 34,057.0 | 47,636.2 | 66,629.8 | 93,196.4 | 130,355.7 | 182,331.2 |
| Revenue Growth, % | 0 | 41.14 | 53.44 | 35.99 | 28.92 | 39.87 | 39.87 | 39.87 | 39.87 | 39.87 |
| EBITDA | -1,058.6 | -414.6 | 1,491.1 | 3,186.8 | 5,065.0 | 1,861.1 | 2,603.2 | 3,641.1 | 5,092.9 | 7,123.5 |
| EBITDA, % | -11.8 | -3.27 | 7.68 | 12.06 | 14.87 | 3.91 | 3.91 | 3.91 | 3.91 | 3.91 |
| Depreciation | 475.7 | 719.4 | 1,306.6 | 2,028.2 | 2,930.0 | 3,238.4 | 4,529.6 | 6,335.7 | 8,861.9 | 12,395.3 |
| Depreciation, % | 5.3 | 5.68 | 6.73 | 7.68 | 8.6 | 6.8 | 6.8 | 6.8 | 6.8 | 6.8 |
| EBIT | -1,534.3 | -1,134.0 | 184.5 | 1,158.6 | 2,135.0 | -1,377.3 | -1,926.5 | -2,694.6 | -3,769.0 | -5,271.8 |
| EBIT, % | -17.1 | -8.96 | 0.94979 | 4.39 | 6.27 | -2.89 | -2.89 | -2.89 | -2.89 | -2.89 |
| Total Cash | 8,212.1 | 21,500.0 | 17,736.0 | 14,137.9 | 18,017.0 | 37,086.3 | 51,873.3 | 72,556.3 | 101,485.9 | 141,950.4 |
| Total Cash, percent | .0 | .0 | .0 | .0 | .0 | .0 | .0 | .0 | .0 | .0 |
| Account Receivables | 1,731.6 | 2,880.0 | 3,928.1 | 5,686.3 | 9,593.0 | 10,667.0 | 14,920.2 | 20,869.2 | 29,190.2 | 40,828.9 |
| Account Receivables, % | 19.3 | 22.75 | 20.22 | 21.52 | 28.17 | 22.39 | 22.39 | 22.39 | 22.39 | 22.39 |
| Inventories | .0 | .0 | .0 | .0 | .0 | .0 | .0 | .0 | .0 | .0 |
| Inventories, % | 0 | 0 | 0 | 0 | 0 | 0 | 0 | 0 | 0 | 0 |
| Accounts Payable | 1,012.5 | 1,477.8 | 1,833.8 | 2,435.8 | 3,360.0 | 4,905.1 | 6,860.9 | 9,596.5 | 13,422.8 | 18,774.8 |
| Accounts Payable, % | 11.29 | 11.67 | 9.44 | 9.22 | 9.87 | 10.3 | 10.3 | 10.3 | 10.3 | 10.3 |
| Capital Expenditure | -20.6 | -102.8 | -97.6 | -117.8 | -74.0 | -210.4 | -294.3 | -411.6 | -575.7 | -805.2 |
| Capital Expenditure, % | -0.23003 | -0.81214 | -0.50265 | -0.44609 | -0.21728 | -0.44164 | -0.44164 | -0.44164 | -0.44164 | -0.44164 |
| Tax Rate, % | -41.95 | -41.95 | -41.95 | -41.95 | -41.95 | -41.95 | -41.95 | -41.95 | -41.95 | -41.95 |
| EBITAT | -1,432.1 | -1,142.2 | 35.5 | 1,092.3 | 3,030.6 | -1,120.7 | -1,567.5 | -2,192.5 | -3,066.7 | -4,289.5 |
| Depreciation | ||||||||||
| Changes in Account Receivables | ||||||||||
| Changes in Inventories | ||||||||||
| Changes in Accounts Payable | ||||||||||
| Capital Expenditure | ||||||||||
| UFCF | -1,696.2 | -1,208.8 | 552.4 | 1,846.4 | 2,904.1 | 2,378.5 | 370.5 | 518.2 | 724.8 | 1,013.8 |
| WACC, % | 9.15 | 9.16 | 8.96 | 9.15 | 9.16 | 9.12 | 9.12 | 9.12 | 9.12 | 9.12 |
| PV UFCF | ||||||||||
| SUM PV UFCF | 4,056.3 | |||||||||
| Long Term Growth Rate, % | 4.00 | |||||||||
| Free cash flow (T + 1) | 1,054 | |||||||||
| Terminal Value | 20,601 | |||||||||
| Present Terminal Value | 13,317 | |||||||||
| Enterprise Value | 17,374 | |||||||||
| Net Debt | -1,717 | |||||||||
| Equity Value | 19,091 | |||||||||
| Diluted Shares Outstanding, MM | 103 | |||||||||
| Equity Value Per Share | 185.68 |
What You Will Gain
- Pre-Loaded Financial Model: Access to Appier Group, Inc.’s actual data for accurate DCF valuation.
- Comprehensive Forecast Control: Modify revenue growth rates, profit margins, WACC, and other essential factors.
- Real-Time Calculations: Automatic updates provide immediate insights as you adjust your inputs.
- Professional-Grade Template: A polished Excel file crafted for high-quality valuation presentations.
- Customizable and Versatile: Designed to be flexible, enabling repeated utilization for thorough forecasts.
Key Features
- Accurate Appier Financials: Access reliable pre-loaded historical data and future forecasts.
- Flexible Forecast Assumptions: Adjust highlighted fields for WACC, growth rates, and profit margins.
- Real-Time Calculations: Automatic updates for DCF, Net Present Value (NPV), and cash flow assessments.
- User-Friendly Dashboard: Intuitive charts and summaries to easily interpret your valuation results.
- Suitable for All Skill Levels: A straightforward, accessible layout designed for investors, CFOs, and consultants alike.
How It Works
- Step 1: Download the Excel file for Appier Group, Inc. (4180T).
- Step 2: Examine the pre-filled financial data and forecasts specific to Appier Group.
- Step 3: Adjust key inputs such as revenue growth, WACC, and tax rates (highlighted cells).
- Step 4: Observe the DCF model update in real-time as you modify your assumptions.
- Step 5: Evaluate the outputs and leverage the results for informed investment decisions.
Why Choose This Calculator?
- User-Friendly Interface: Tailored for both novices and seasoned professionals.
- Customizable Inputs: Adjust parameters effortlessly to align with your analysis needs.
- Real-Time Adjustments: Observe immediate changes to Appier Group, Inc.'s valuation as you tweak the inputs.
- Preconfigured Data: Comes with Appier Group, Inc.'s actual financial metrics for swift evaluations.
- Endorsed by Experts: Valued by investors and analysts for making well-informed decisions.
Who Should Utilize This Product?
- Investors: Accurately assess the fair value of Appier Group, Inc. (4180T) before making investment choices.
- CFOs: Utilize a high-quality DCF model for financial reporting and strategic analysis.
- Consultants: Seamlessly customize the template for client valuation reports.
- Entrepreneurs: Acquire insights into the financial modeling practices of leading companies.
- Educators: Employ it as a teaching resource to illustrate various valuation techniques.
Contents of the Template
- Pre-Filled Data: Contains Appier Group, Inc.'s historical financial data and projections.
- Discounted Cash Flow Model: An editable DCF valuation model featuring automatic calculations.
- Weighted Average Cost of Capital (WACC): A specific sheet for calculating WACC using personalized inputs.
- Key Financial Ratios: Evaluate Appier Group, Inc.’s profitability, efficiency, and financial leverage.
- Customizable Inputs: Easily modify revenue growth, profit margins, and tax rates.
- Clear Dashboard: Visual representations and tables that summarize important valuation outcomes.
Disclaimer
All information, articles, and product details provided on this website are for general informational and educational purposes only. We do not claim any ownership over, nor do we intend to infringe upon, any trademarks, copyrights, logos, brand names, or other intellectual property mentioned or depicted on this site. Such intellectual property remains the property of its respective owners, and any references here are made solely for identification or informational purposes, without implying any affiliation, endorsement, or partnership.
We make no representations or warranties, express or implied, regarding the accuracy, completeness, or suitability of any content or products presented. Nothing on this website should be construed as legal, tax, investment, financial, medical, or other professional advice. In addition, no part of this site—including articles or product references—constitutes a solicitation, recommendation, endorsement, advertisement, or offer to buy or sell any securities, franchises, or other financial instruments, particularly in jurisdictions where such activity would be unlawful.
All content is of a general nature and may not address the specific circumstances of any individual or entity. It is not a substitute for professional advice or services. Any actions you take based on the information provided here are strictly at your own risk. You accept full responsibility for any decisions or outcomes arising from your use of this website and agree to release us from any liability in connection with your use of, or reliance upon, the content or products found herein.