
|
Ube Corporation (4208.T) Valoración de DCF |
Completamente Editable: Adáptelo A Sus Necesidades En Excel O Sheets
Diseño Profesional: Plantillas Confiables Y Estándares De La Industria
Predeterminadas Para Un Uso Rápido Y Eficiente
Compatible con MAC / PC, completamente desbloqueado
No Se Necesita Experiencia; Fáciles De Seguir
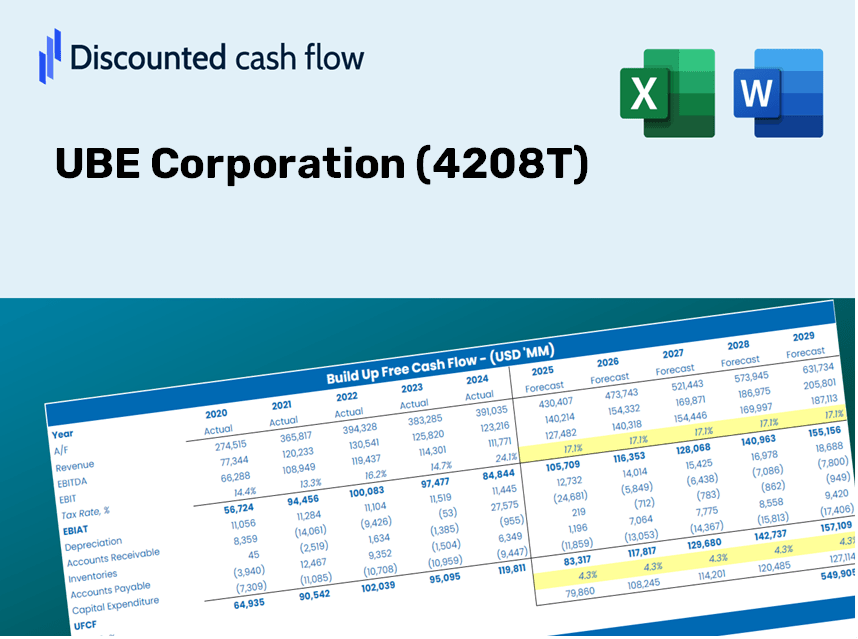
UBE Corporation (4208.T) Bundle
¡Explore las perspectivas financieras de UBe Corporation (4208T) con nuestra calculadora DCF fácil de usar! Ingrese sus suposiciones para el crecimiento, los márgenes y los costos para determinar el valor intrínseco de UBE Corporation (4208T) y refinar su estrategia de inversión.
Discounted Cash Flow (DCF) - (USD MM)
| Year | AY1 2021 |
AY2 2022 |
AY3 2023 |
AY4 2024 |
AY5 2025 |
FY1 2026 |
FY2 2027 |
FY3 2028 |
FY4 2029 |
FY5 2030 |
|---|---|---|---|---|---|---|---|---|---|---|
| Revenue | 613,889.0 | 655,265.0 | 494,738.0 | 468,237.0 | 486,802.0 | 463,496.7 | 441,307.1 | 420,179.8 | 400,063.9 | 380,911.1 |
| Revenue Growth, % | 0 | 6.74 | -24.5 | -5.36 | 3.96 | -4.79 | -4.79 | -4.79 | -4.79 | -4.79 |
| EBITDA | 59,972.0 | 74,395.0 | 23,634.0 | 62,812.0 | 18,258.0 | 39,920.8 | 38,009.7 | 36,190.0 | 34,457.4 | 32,807.8 |
| EBITDA, % | 9.77 | 11.35 | 4.78 | 13.41 | 3.75 | 8.61 | 8.61 | 8.61 | 8.61 | 8.61 |
| Depreciation | 36,382.0 | 36,506.0 | 25,506.0 | 26,702.0 | 27,418.0 | 25,944.7 | 24,702.7 | 23,520.0 | 22,394.0 | 21,321.9 |
| Depreciation, % | 5.93 | 5.57 | 5.16 | 5.7 | 5.63 | 5.6 | 5.6 | 5.6 | 5.6 | 5.6 |
| EBIT | 23,590.0 | 37,889.0 | -1,872.0 | 36,110.0 | -9,160.0 | 13,976.1 | 13,307.0 | 12,669.9 | 12,063.4 | 11,485.8 |
| EBIT, % | 3.84 | 5.78 | -0.37838 | 7.71 | -1.88 | 3.02 | 3.02 | 3.02 | 3.02 | 3.02 |
| Total Cash | 80,304.0 | 79,492.0 | 31,175.0 | 36,359.0 | 115,969.0 | 58,494.7 | 55,694.3 | 53,027.9 | 50,489.3 | 48,072.1 |
| Total Cash, percent | .0 | .0 | .0 | .0 | .0 | .0 | .0 | .0 | .0 | .0 |
| Account Receivables | 149,053.0 | 171,358.0 | 106,998.0 | 107,703.0 | 106,480.0 | 108,396.5 | 103,207.1 | 98,266.1 | 93,561.7 | 89,082.5 |
| Account Receivables, % | 24.28 | 26.15 | 21.63 | 23 | 21.87 | 23.39 | 23.39 | 23.39 | 23.39 | 23.39 |
| Inventories | 87,834.0 | 124,709.0 | 127,008.0 | 133,948.0 | 121,989.0 | 104,451.3 | 99,450.8 | 94,689.7 | 90,156.4 | 85,840.3 |
| Inventories, % | 14.31 | 19.03 | 25.67 | 28.61 | 25.06 | 22.54 | 22.54 | 22.54 | 22.54 | 22.54 |
| Accounts Payable | 90,831.0 | 110,766.0 | 69,241.0 | 62,068.0 | 48,258.0 | 63,836.9 | 60,780.7 | 57,870.9 | 55,100.4 | 52,462.5 |
| Accounts Payable, % | 14.8 | 16.9 | 14 | 13.26 | 9.91 | 13.77 | 13.77 | 13.77 | 13.77 | 13.77 |
| Capital Expenditure | -38,208.0 | -36,379.0 | -26,829.0 | -30,972.0 | -58,930.0 | -33,296.4 | -31,702.4 | -30,184.6 | -28,739.6 | -27,363.7 |
| Capital Expenditure, % | -6.22 | -5.55 | -5.42 | -6.61 | -12.11 | -7.18 | -7.18 | -7.18 | -7.18 | -7.18 |
| Tax Rate, % | 55.78 | 55.78 | 55.78 | 55.78 | 55.78 | 55.78 | 55.78 | 55.78 | 55.78 | 55.78 |
| EBITAT | 24,118.9 | 25,229.1 | -5,052.1 | 29,842.1 | -4,050.9 | 10,997.9 | 10,471.4 | 9,970.1 | 9,492.8 | 9,038.3 |
| Depreciation | ||||||||||
| Changes in Account Receivables | ||||||||||
| Changes in Inventories | ||||||||||
| Changes in Accounts Payable | ||||||||||
| Capital Expenditure | ||||||||||
| UFCF | -123,763.1 | -13,888.9 | 14,160.9 | 10,754.1 | -36,190.9 | 34,846.2 | 10,605.4 | 10,097.7 | 9,614.3 | 9,154.0 |
| WACC, % | 4.04 | 3.32 | 4.04 | 3.67 | 2.84 | 3.58 | 3.58 | 3.58 | 3.58 | 3.58 |
| PV UFCF | ||||||||||
| SUM PV UFCF | 68,643.9 | |||||||||
| Long Term Growth Rate, % | 3.50 | |||||||||
| Free cash flow (T + 1) | 9,474 | |||||||||
| Terminal Value | 11,884,551 | |||||||||
| Present Terminal Value | 9,968,025 | |||||||||
| Enterprise Value | 10,036,669 | |||||||||
| Net Debt | 214,567 | |||||||||
| Equity Value | 9,822,102 | |||||||||
| Diluted Shares Outstanding, MM | 97 | |||||||||
| Equity Value Per Share | 101,159.71 |
What You Will Receive
- Authentic UBE Data: Preloaded financial statistics – covering revenue to EBIT – derived from both actual and forecasted metrics.
- Complete Customization: Modify all key parameters (yellow cells) such as WACC, growth %, and tax rates to fit your analysis.
- Real-Time Valuation Adjustments: Automatic recalculations to assess the impact of changes on UBE Corporation’s fair value.
- Flexible Excel Template: Designed for quick modifications, scenario testing, and comprehensive forecasting.
- Efficient and Precise: Avoid constructing models from the ground up while ensuring accuracy and adaptability.
Key Features
- 🔍 Real-Life UBE Financials: Pre-filled historical and projected data for UBE Corporation (4208T).
- ✏️ Fully Customizable Inputs: Adjust all critical parameters (yellow cells) such as WACC, growth %, and tax rates.
- 📊 Professional DCF Valuation: Built-in formulas calculate UBE’s intrinsic value using the Discounted Cash Flow method.
- ⚡ Instant Results: Visualize UBE’s valuation instantly after making adjustments.
- Scenario Analysis: Test and compare outcomes for various financial assumptions side-by-side.
How It Functions
- 1. Access the Template: Download and open the Excel file containing UBE Corporation’s (4208T) preloaded data.
- 2. Adjust Assumptions: Modify key parameters such as growth rates, WACC, and capital expenditures.
- 3. View Instant Results: The DCF model automatically computes intrinsic value and NPV.
- 4. Evaluate Scenarios: Analyze various forecasts to explore different valuation outcomes.
- 5. Present with Assurance: Share professional valuation insights to enhance your decision-making process.
Why Opt for This Calculator?
- Designed for Experts: A sophisticated tool tailored for analysts, CFOs, and consultants.
- Accurate Financial Data: UBE Corporation’s historical and projected financials are preloaded for precision.
- Scenario Analysis: Effortlessly simulate various forecasts and assumptions.
- Intuitive Outputs: Automatically computes intrinsic value, NPV, and essential metrics.
- User-Friendly: Step-by-step guidance makes the process seamless.
Who Can Benefit from This Product?
- Investors: Evaluate UBE Corporation’s (4208T) valuation prior to making stock trades.
- CFOs and Financial Analysts: Enhance valuation processes and validate financial forecasts.
- Startup Founders: Discover how large corporations like UBE Corporation (4208T) are assessed in the market.
- Consultants: Provide comprehensive valuation reports for your clients regarding UBE Corporation (4208T).
- Students and Educators: Utilize real market data for practicing and teaching valuation methodologies.
Contents of the Template
- Preloaded UBE Data: Historical and projected financial metrics, including revenue, EBIT, and capital expenditures.
- DCF and WACC Models: Advanced templates for calculating intrinsic value and Weighted Average Cost of Capital.
- Editable Inputs: Yellow-highlighted cells for modifying revenue growth, tax rates, and discount rates.
- Financial Statements: Detailed annual and quarterly financial statements for thorough analysis.
- Key Ratios: Profitability, leverage, and efficiency ratios to assess company performance.
- Dashboard and Charts: Visual representations of valuation results and underlying assumptions.
Disclaimer
All information, articles, and product details provided on this website are for general informational and educational purposes only. We do not claim any ownership over, nor do we intend to infringe upon, any trademarks, copyrights, logos, brand names, or other intellectual property mentioned or depicted on this site. Such intellectual property remains the property of its respective owners, and any references here are made solely for identification or informational purposes, without implying any affiliation, endorsement, or partnership.
We make no representations or warranties, express or implied, regarding the accuracy, completeness, or suitability of any content or products presented. Nothing on this website should be construed as legal, tax, investment, financial, medical, or other professional advice. In addition, no part of this site—including articles or product references—constitutes a solicitation, recommendation, endorsement, advertisement, or offer to buy or sell any securities, franchises, or other financial instruments, particularly in jurisdictions where such activity would be unlawful.
All content is of a general nature and may not address the specific circumstances of any individual or entity. It is not a substitute for professional advice or services. Any actions you take based on the information provided here are strictly at your own risk. You accept full responsibility for any decisions or outcomes arising from your use of this website and agree to release us from any liability in connection with your use of, or reliance upon, the content or products found herein.