
|
NOF Corporation (4403.T) DCF Valoración |
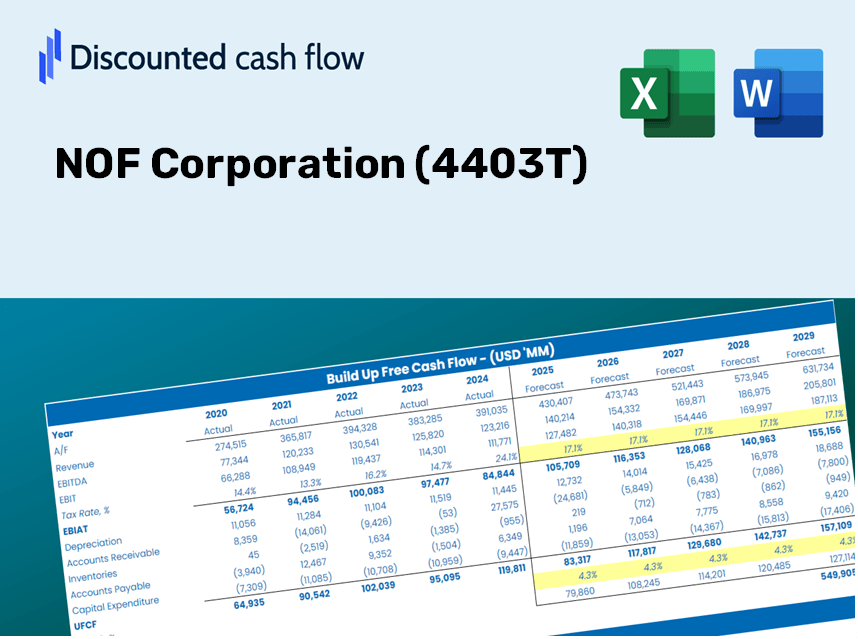
Completamente Editable: Adáptelo A Sus Necesidades En Excel O Sheets
Diseño Profesional: Plantillas Confiables Y Estándares De La Industria
Predeterminadas Para Un Uso Rápido Y Eficiente
Compatible con MAC / PC, completamente desbloqueado
No Se Necesita Experiencia; Fáciles De Seguir
NOF Corporation (4403.T) Bundle
¡Simplifique la valoración de NOF Corporation (4403T) con esta calculadora DCF personalizable! Con Real NOF Corporation (4403T) financieras y entradas de pronóstico ajustables, puede probar escenarios y descubrir el valor razonable de NOF Corporation (4403T) en minutos.
Discounted Cash Flow (DCF) - (USD MM)
| Year | AY1 2021 |
AY2 2022 |
AY3 2023 |
AY4 2024 |
AY5 2025 |
FY1 2026 |
FY2 2027 |
FY3 2028 |
FY4 2029 |
FY5 2030 |
|---|---|---|---|---|---|---|---|---|---|---|
| Revenue | 172,645.0 | 192,642.0 | 217,709.0 | 222,252.0 | 238,310.0 | 258,510.8 | 280,424.0 | 304,194.7 | 329,980.4 | 357,951.9 |
| Revenue Growth, % | 0 | 11.58 | 13.01 | 2.09 | 7.23 | 8.48 | 8.48 | 8.48 | 8.48 | 8.48 |
| EBITDA | 39,723.0 | 43,946.0 | 46,984.0 | 49,081.0 | 58,882.0 | 59,040.5 | 64,045.2 | 69,474.1 | 75,363.2 | 81,751.6 |
| EBITDA, % | 23.01 | 22.81 | 21.58 | 22.08 | 24.71 | 22.84 | 22.84 | 22.84 | 22.84 | 22.84 |
| Depreciation | 5,553.0 | 5,909.0 | 6,359.0 | 6,939.0 | 7,965.0 | 8,101.2 | 8,788.0 | 9,532.9 | 10,341.0 | 11,217.5 |
| Depreciation, % | 3.22 | 3.07 | 2.92 | 3.12 | 3.34 | 3.13 | 3.13 | 3.13 | 3.13 | 3.13 |
| EBIT | 34,170.0 | 38,037.0 | 40,625.0 | 42,142.0 | 50,917.0 | 50,939.3 | 55,257.2 | 59,941.2 | 65,022.3 | 70,534.0 |
| EBIT, % | 19.79 | 19.74 | 18.66 | 18.96 | 21.37 | 19.7 | 19.7 | 19.7 | 19.7 | 19.7 |
| Total Cash | 78,669.0 | 85,430.0 | 92,520.0 | 91,744.0 | 87,064.0 | 108,690.2 | 117,903.6 | 127,897.9 | 138,739.4 | 150,499.9 |
| Total Cash, percent | .0 | .0 | .0 | .0 | .0 | .0 | .0 | .0 | .0 | .0 |
| Account Receivables | 41,765.0 | 45,052.0 | 48,786.0 | 57,968.0 | 62,593.0 | 63,249.3 | 68,610.7 | 74,426.7 | 80,735.6 | 87,579.3 |
| Account Receivables, % | 24.19 | 23.39 | 22.41 | 26.08 | 26.27 | 24.47 | 24.47 | 24.47 | 24.47 | 24.47 |
| Inventories | 32,326.0 | 39,900.0 | 49,736.0 | 51,006.0 | 57,326.0 | 56,503.2 | 61,292.8 | 66,488.4 | 72,124.5 | 78,238.2 |
| Inventories, % | 18.72 | 20.71 | 22.85 | 22.95 | 24.06 | 21.86 | 21.86 | 21.86 | 21.86 | 21.86 |
| Accounts Payable | 17,129.0 | 21,262.0 | 18,496.0 | 23,114.0 | 23,885.0 | 25,787.4 | 27,973.3 | 30,344.6 | 32,916.8 | 35,707.0 |
| Accounts Payable, % | 9.92 | 11.04 | 8.5 | 10.4 | 10.02 | 9.98 | 9.98 | 9.98 | 9.98 | 9.98 |
| Capital Expenditure | -5,982.0 | -7,416.0 | -6,219.0 | -17,748.0 | -16,336.0 | -12,931.5 | -14,027.7 | -15,216.8 | -16,506.7 | -17,905.9 |
| Capital Expenditure, % | -3.46 | -3.85 | -2.86 | -7.99 | -6.85 | -5 | -5 | -5 | -5 | -5 |
| Tax Rate, % | 28.12 | 28.12 | 28.12 | 28.12 | 28.12 | 28.12 | 28.12 | 28.12 | 28.12 | 28.12 |
| EBITAT | 23,343.7 | 26,732.2 | 28,729.2 | 29,553.7 | 36,597.9 | 35,792.0 | 38,826.0 | 42,117.1 | 45,687.3 | 49,560.0 |
| Depreciation | ||||||||||
| Changes in Account Receivables | ||||||||||
| Changes in Inventories | ||||||||||
| Changes in Accounts Payable | ||||||||||
| Capital Expenditure | ||||||||||
| UFCF | -34,047.3 | 18,497.2 | 12,533.2 | 12,910.7 | 18,052.9 | 33,030.6 | 25,621.1 | 27,792.9 | 30,148.8 | 32,704.5 |
| WACC, % | 6.44 | 6.44 | 6.44 | 6.44 | 6.44 | 6.44 | 6.44 | 6.44 | 6.44 | 6.44 |
| PV UFCF | ||||||||||
| SUM PV UFCF | 124,128.4 | |||||||||
| Long Term Growth Rate, % | 2.00 | |||||||||
| Free cash flow (T + 1) | 33,359 | |||||||||
| Terminal Value | 751,744 | |||||||||
| Present Terminal Value | 550,297 | |||||||||
| Enterprise Value | 674,425 | |||||||||
| Net Debt | -82,023 | |||||||||
| Equity Value | 756,448 | |||||||||
| Diluted Shares Outstanding, MM | 237 | |||||||||
| Equity Value Per Share | 3,189.33 |
What You Will Receive
- Customizable Excel Template: A fully adaptable Excel-based DCF Calculator featuring pre-filled financial data for NOF Corporation (4403T).
- Accurate Data: Access to historical figures and forward-looking projections (highlighted in the yellow cells).
- Flexible Forecasting: Adjust forecast variables such as revenue growth, EBITDA margin, and WACC.
- Real-Time Calculations: Instantly observe how your inputs affect NOF Corporation’s valuation.
- Professional Resource: Designed for investors, CFOs, consultants, and financial analysts.
- User-Centric Layout: Organized for clarity and ease of navigation, complete with step-by-step guidance.
Key Features
- 🔍 Real-Life NOF Financials: Pre-filled historical and projected data for NOF Corporation (4403T).
- ✏️ Fully Customizable Inputs: Adjust all critical parameters (yellow cells) such as WACC, growth %, and tax rates.
- 📊 Professional DCF Valuation: Built-in formulas calculate NOF’s intrinsic value using the Discounted Cash Flow method.
- ⚡ Instant Results: Visualize NOF’s valuation instantly after making changes.
- Scenario Analysis: Test and compare outcomes for various financial assumptions side-by-side.
How It Works
- Step 1: Download the prebuilt Excel template featuring NOF Corporation’s (4403T) data.
- Step 2: Review the pre-filled sheets to familiarize yourself with the essential metrics.
- Step 3: Modify forecasts and assumptions in the editable yellow cells (WACC, growth, margins).
- Step 4: Instantly observe the updated results, including NOF Corporation’s (4403T) intrinsic value.
- Step 5: Utilize the outputs to make well-informed investment decisions or create reports.
Why Choose the NOF Corporation (4403T) Calculator?
- Time Efficient: Skip the hassle of building a DCF model from the ground up – it’s fully prepared for use.
- Enhanced Accuracy: Dependable financial data and calculations minimize valuation errors.
- Completely Customizable: Adjust the model to align with your unique assumptions and forecasts.
- User-Friendly: Intuitive charts and outputs simplify the analysis of results.
- Endorsed by Professionals: Crafted for experts who prioritize both precision and ease of use.
Who Can Benefit from NOF Corporation’s Offerings?
- Investors: Make informed choices with our top-tier valuation tools tailored for [Symbol].
- Financial Analysts: Streamline your workflow with a customizable, pre-built DCF model designed for [Symbol].
- Consultants: Rapidly modify our templates for impactful client presentations or comprehensive reports on [Symbol].
- Finance Enthusiasts: Enhance your knowledge of valuation methods through real-world applications related to [Symbol].
- Educators and Students: Leverage our resources as effective teaching aids in finance courses focusing on [Symbol].
Contents of the Template
- Pre-Filled DCF Model: NOF Corporation's (4403T) financial data pre-loaded for immediate application.
- WACC Calculator: Comprehensive calculations for the Weighted Average Cost of Capital.
- Financial Ratios: Assess NOF Corporation's (4403T) profitability, leverage, and operational efficiency.
- Editable Inputs: Customize assumptions such as growth rates, profit margins, and CAPEX to suit your analysis.
- Financial Statements: Access annual and quarterly reports to facilitate in-depth analysis.
- Interactive Dashboard: Effortlessly visualize essential valuation metrics and outcomes.
Disclaimer
All information, articles, and product details provided on this website are for general informational and educational purposes only. We do not claim any ownership over, nor do we intend to infringe upon, any trademarks, copyrights, logos, brand names, or other intellectual property mentioned or depicted on this site. Such intellectual property remains the property of its respective owners, and any references here are made solely for identification or informational purposes, without implying any affiliation, endorsement, or partnership.
We make no representations or warranties, express or implied, regarding the accuracy, completeness, or suitability of any content or products presented. Nothing on this website should be construed as legal, tax, investment, financial, medical, or other professional advice. In addition, no part of this site—including articles or product references—constitutes a solicitation, recommendation, endorsement, advertisement, or offer to buy or sell any securities, franchises, or other financial instruments, particularly in jurisdictions where such activity would be unlawful.
All content is of a general nature and may not address the specific circumstances of any individual or entity. It is not a substitute for professional advice or services. Any actions you take based on the information provided here are strictly at your own risk. You accept full responsibility for any decisions or outcomes arising from your use of this website and agree to release us from any liability in connection with your use of, or reliance upon, the content or products found herein.